How To Calculate The Cumulative Percentage
Holbox
Mar 09, 2025 · 5 min read
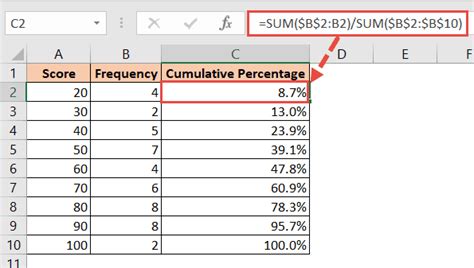
Table of Contents
How to Calculate Cumulative Percentage: A Comprehensive Guide
Calculating cumulative percentage is a fundamental skill with applications across numerous fields, from finance and statistics to data analysis and project management. Understanding how to calculate and interpret cumulative percentages allows you to track progress, identify trends, and make informed decisions based on your data. This comprehensive guide will walk you through the process, covering different methods, providing examples, and offering tips for accurate calculations.
What is Cumulative Percentage?
The cumulative percentage represents the running total of percentages in a dataset. It shows the accumulation of a particular value over time or across categories. Instead of focusing on individual percentages, the cumulative percentage focuses on the total percentage up to a specific point. This is particularly useful when analyzing trends or tracking progress towards a goal.
For example, imagine you're tracking the sales of a new product over four quarters. Instead of just looking at the percentage of total sales for each quarter individually, a cumulative percentage reveals the total percentage of sales achieved up to the end of each quarter. This helps to visualize the overall sales growth over time.
Methods for Calculating Cumulative Percentage
There are several methods to calculate cumulative percentage, depending on the format of your data. We'll explore two primary approaches: using a spreadsheet program (like Excel or Google Sheets) and manual calculation.
Method 1: Using Spreadsheet Software (Excel/Google Sheets)
Spreadsheet software provides a streamlined approach to calculating cumulative percentages. This method is efficient, especially for large datasets.
Steps:
-
Input your data: Enter your data into the spreadsheet. Let's assume your data represents the number of units sold each month:
Month Units Sold January 100 February 150 March 200 April 250 May 300 -
Calculate the total: In a separate cell, calculate the total units sold using the
SUMfunction:=SUM(B2:B6)(assuming your data is in cells B2 to B6). This will give you the total, which in this case is 1000. -
Calculate individual percentages: In a new column, calculate the percentage of total sales for each month. Use the formula:
=B2/$B$7(where B2 is the units sold for January and $B$7 is the cell containing the total, the$signs make the cell reference absolute). Copy this formula down for all months. -
Calculate cumulative percentage: In another column, calculate the cumulative percentage. For the first month, the cumulative percentage is the same as the individual percentage. For subsequent months, add the current month's percentage to the previous month's cumulative percentage. The formula for the second month would be:
=C2+C3(where C2 is the percentage for January and C3 is the percentage for February). Copy this formula down for all remaining months.Your spreadsheet should now look something like this:
Month Units Sold Percentage Cumulative Percentage January 100 10% 10% February 150 15% 25% March 200 20% 45% April 250 25% 70% May 300 30% 100%
Method 2: Manual Calculation
For smaller datasets, manual calculation is feasible.
Steps:
-
Calculate the total: Sum all the values in your dataset. Let's use the same example as above: 100 + 150 + 200 + 250 + 300 = 1000
-
Calculate individual percentages: Divide each value by the total and multiply by 100 to express it as a percentage.
- January: (100/1000) * 100 = 10%
- February: (150/1000) * 100 = 15%
- March: (200/1000) * 100 = 20%
- April: (250/1000) * 100 = 25%
- May: (300/1000) * 100 = 30%
-
Calculate cumulative percentage: Add the percentages cumulatively.
- January: 10%
- February: 10% + 15% = 25%
- March: 25% + 20% = 45%
- April: 45% + 25% = 70%
- May: 70% + 30% = 100%
Interpreting Cumulative Percentages
Understanding how to interpret cumulative percentages is crucial. They provide a clear picture of the overall progress or trend. In our sales example, the cumulative percentage shows that after five months, 100% of the target sales were achieved. If the target was lower, you could easily see how far ahead of target the sales were.
Cumulative percentages are particularly useful for:
- Tracking progress towards a goal: Monitoring progress in projects, sales targets, or any other objective.
- Identifying trends: Spotting patterns and changes over time. For instance, a rapid increase in the cumulative percentage indicates accelerated growth.
- Comparing performance: Comparing the performance of different products, teams, or departments over time.
- Data visualization: Presenting data in a clear and easily understandable manner, often using charts or graphs.
Advanced Applications and Considerations
Dealing with Negative Values
Cumulative percentages are primarily designed for positive values. If you have negative values, the cumulative percentage might not provide a meaningful representation. You might need to adjust your approach based on the nature of your data and the interpretation you require. For instance, you could calculate cumulative sums and then convert to percentages only if the cumulative sum is positive. Alternatively, you might need a different type of analysis altogether.
Weighted Cumulative Percentages
In some cases, you might need to consider weighted cumulative percentages, where each value contributes differently to the total. This is common in situations involving weighted averages or where different values hold varying significance. You would incorporate weights into your calculations before calculating individual and cumulative percentages.
Using Charts and Graphs
Visualizing your cumulative percentages using charts and graphs (like line charts or area charts) significantly improves understanding and communication. A visual representation instantly reveals trends and makes it easier to identify key milestones.
Conclusion
Calculating cumulative percentages is a valuable skill for anyone working with data. Whether using spreadsheet software or manual calculation, the process is straightforward. The real power lies in understanding how to interpret the results and use them to gain insights into trends, progress, and performance. Remember to choose the method that best suits your data and analytical needs, always considering the context and potential limitations. Mastering cumulative percentage calculations will enhance your data analysis skills and enable more informed decision-making.
Latest Posts
Latest Posts
-
What Is A Classified Balance Sheet
Mar 09, 2025
-
French Nouns That Start With U
Mar 09, 2025
-
Weak Acid And Weak Base Titration
Mar 09, 2025
-
I Dont Like This In Spanish
Mar 09, 2025
-
Like Zirconium On The Periodic Table
Mar 09, 2025
Related Post
Thank you for visiting our website which covers about How To Calculate The Cumulative Percentage . We hope the information provided has been useful to you. Feel free to contact us if you have any questions or need further assistance. See you next time and don't miss to bookmark.
