How Is A Debt Ratio Of 0.45 Interpreted
Holbox
Mar 21, 2025 · 6 min read
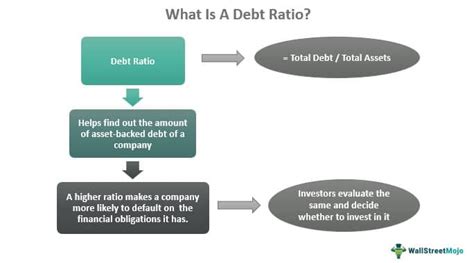
Table of Contents
- How Is A Debt Ratio Of 0.45 Interpreted
- Table of Contents
- How is a Debt Ratio of 0.45 Interpreted? A Comprehensive Guide
- Understanding the Debt Ratio
- Importance of Context: Industry Benchmarks and Company History
- Analyzing a 0.45 Debt Ratio: Positive and Negative Implications
- Potential Positive Implications:
- Potential Negative Implications:
- Further Analysis: Complementary Financial Ratios
- 1. Times Interest Earned (TIE) Ratio:
- 2. Debt-to-Equity Ratio:
- 3. Current Ratio and Quick Ratio:
- 4. Return on Assets (ROA) and Return on Equity (ROE):
- Interpreting the 0.45 Debt Ratio: A Case Study Approach
- Conclusion: Holistic Financial Assessment is Key
- Latest Posts
- Latest Posts
- Related Post
How is a Debt Ratio of 0.45 Interpreted? A Comprehensive Guide
A debt ratio of 0.45 signifies that for every dollar of assets a company owns, it has $0.45 in debt. This seemingly simple figure, however, holds significant weight in financial analysis, offering valuable insights into a company's financial health and risk profile. Understanding how to interpret this ratio requires considering its context within the industry, the company's overall financial picture, and relevant financial trends. This comprehensive guide delves into the intricacies of interpreting a 0.45 debt ratio, equipping you with the knowledge to make informed financial decisions.
Understanding the Debt Ratio
The debt ratio is a crucial financial metric calculated by dividing a company's total debt by its total assets. The formula is straightforward:
Debt Ratio = Total Debt / Total Assets
A debt ratio of 0.45 indicates that 45% of a company's assets are financed by debt, while the remaining 55% is financed by equity. This ratio is a measure of leverage, reflecting the extent to which a company uses borrowed funds to finance its operations.
Importance of Context: Industry Benchmarks and Company History
Interpreting a debt ratio of 0.45 requires careful consideration of context. A 0.45 debt ratio might be considered healthy for one industry but risky for another. Capital-intensive industries, such as manufacturing or utilities, often operate with higher debt ratios than less capital-intensive industries like software or services. Industry benchmarks provide crucial comparative data, enabling you to assess whether a 0.45 debt ratio is favorable or unfavorable relative to its competitors.
Furthermore, analyzing the company's historical debt ratios is vital. A sudden increase in the debt ratio from a lower level could indicate a shift in financial strategy or potential financial distress. Conversely, a consistent and stable debt ratio at 0.45 might signal a well-managed and sustainable financial position.
Analyzing a 0.45 Debt Ratio: Positive and Negative Implications
A debt ratio of 0.45 doesn't automatically signify good or bad financial health. Its interpretation hinges on various factors:
Potential Positive Implications:
- Efficient Use of Leverage: A 0.45 debt ratio could reflect the company's ability to leverage debt effectively to finance growth and expansion. Borrowing at favorable interest rates can amplify returns on invested capital.
- Strong Asset Base: A relatively high asset base compared to debt implies that the company possesses substantial resources that can serve as collateral or buffer against potential financial difficulties.
- Sustainable Debt Management: A consistent 0.45 debt ratio over time suggests that the company has a well-established and sustainable debt management strategy. This points to a responsible approach to financing.
- Investment Opportunities: The company might have strategically used debt to finance profitable investments, increasing its overall value and profitability.
Potential Negative Implications:
- High Interest Expense: A significant portion of the company's earnings might be consumed by interest payments, reducing its profitability and potentially jeopardizing its ability to meet its financial obligations.
- Financial Risk: A debt ratio of 0.45, while not excessively high, still exposes the company to financial risk. A downturn in the economy or unexpected expenses could strain the company's ability to service its debt.
- Limited Financial Flexibility: A high debt load might limit the company's ability to respond quickly to unexpected opportunities or challenges due to its constrained financial resources. The company may struggle to secure further funding.
- Vulnerability to Interest Rate Changes: Rising interest rates could significantly increase the company's debt servicing costs, putting pressure on its profitability and potentially harming its credit rating.
Further Analysis: Complementary Financial Ratios
Analyzing the debt ratio in isolation is insufficient. A comprehensive assessment requires examining it alongside other financial ratios to gain a more nuanced understanding of the company's financial health. Key complementary ratios include:
1. Times Interest Earned (TIE) Ratio:
This ratio assesses a company's ability to meet its interest obligations. A higher TIE ratio indicates better debt servicing capacity. It is calculated as:
TIE Ratio = Earnings Before Interest and Taxes (EBIT) / Interest Expense
A healthy TIE ratio typically exceeds 2.0, suggesting the company can comfortably cover its interest payments even during challenging times. Analyzing the TIE ratio alongside the debt ratio provides a more complete picture of the company's debt management capabilities.
2. Debt-to-Equity Ratio:
This ratio compares the proportion of debt financing to equity financing. It's calculated as:
Debt-to-Equity Ratio = Total Debt / Total Equity
A higher debt-to-equity ratio signals greater reliance on debt financing. Comparing this ratio to industry benchmarks helps determine whether the company's leverage is appropriate given its industry and risk profile.
3. Current Ratio and Quick Ratio:
These ratios measure a company's short-term liquidity, reflecting its ability to meet its short-term obligations. The current ratio includes all current assets, while the quick ratio excludes less liquid assets like inventory.
Current Ratio = Current Assets / Current Liabilities
Quick Ratio = (Current Assets – Inventory) / Current Liabilities
A low current or quick ratio could indicate potential liquidity problems, raising concerns about the company's ability to service its debt, even if the debt ratio is seemingly manageable.
4. Return on Assets (ROA) and Return on Equity (ROE):
These ratios measure profitability relative to assets and equity, respectively. A high ROA or ROE indicates efficient asset utilization and profitability.
ROA = Net Income / Total Assets
ROE = Net Income / Total Equity
High ROA and ROE can mitigate the negative impact of higher leverage, as profits generated can cover the interest expenses.
Interpreting the 0.45 Debt Ratio: A Case Study Approach
To illustrate the interpretation of a 0.45 debt ratio, let's consider two hypothetical companies:
Company A: Operates in a stable industry with low growth potential. Its debt ratio is consistently at 0.45, and its TIE ratio is 3.0. Its current and quick ratios are above 1.5. This suggests a reasonably healthy financial position, with sufficient liquidity and debt servicing capacity.
Company B: Operates in a high-growth industry with significant competition. Its debt ratio recently increased to 0.45 from 0.30, driven by aggressive expansion efforts. While its TIE ratio is 1.8, its current and quick ratios are below 1.0. This scenario calls for caution, indicating potential risks associated with rapid growth and limited liquidity.
Conclusion: Holistic Financial Assessment is Key
A debt ratio of 0.45 is not inherently good or bad. Its interpretation requires a comprehensive analysis incorporating industry benchmarks, historical trends, and complementary financial ratios. While a 0.45 debt ratio might indicate efficient leverage for some companies, it might signal excessive risk for others. A holistic financial assessment, considering all relevant factors, is essential for reaching informed conclusions about a company's financial health and risk profile. Remember to always consider qualitative factors like management quality, industry outlook, and competitive dynamics alongside quantitative data for a complete understanding.
Latest Posts
Latest Posts
-
Process Thinking Causes Managers To Address Critical Process Elements Including
Mar 28, 2025
-
Pearl E White Orthodontist Specializes In Correcting
Mar 28, 2025
-
Complete The Subscripts On The Following Equations
Mar 28, 2025
-
A Monopolist Faces A Downward Sloping Demand Curve Because
Mar 28, 2025
-
Choose The Correct Name For The Following Compound
Mar 28, 2025
Related Post
Thank you for visiting our website which covers about How Is A Debt Ratio Of 0.45 Interpreted . We hope the information provided has been useful to you. Feel free to contact us if you have any questions or need further assistance. See you next time and don't miss to bookmark.
