A Statistical Method For Identifying Cost Behavior Is Called .
Holbox
Mar 21, 2025 · 7 min read
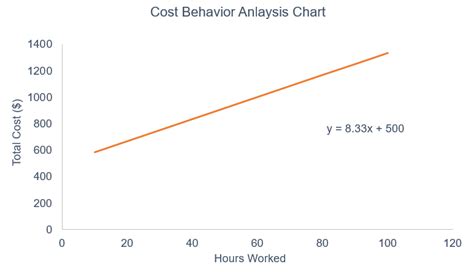
Table of Contents
- A Statistical Method For Identifying Cost Behavior Is Called .
- Table of Contents
- A Statistical Method for Identifying Cost Behavior is Called Regression Analysis
- Understanding Cost Behavior
- Regression Analysis: Unveiling the Cost Behavior
- Simple Linear Regression: Analyzing the Relationship Between Two Variables
- Multiple Linear Regression: Accounting for Multiple Cost Drivers
- Interpreting Regression Results
- Choosing the Right Regression Model
- Limitations of Regression Analysis in Cost Behavior Analysis
- Beyond Simple and Multiple Linear Regression: Other Techniques
- Conclusion
- Latest Posts
- Latest Posts
- Related Post
A Statistical Method for Identifying Cost Behavior is Called Regression Analysis
Identifying the relationship between costs and activity levels is crucial for effective business decision-making. Understanding cost behavior – whether a cost is fixed, variable, or mixed – allows businesses to accurately predict future costs, budget effectively, and make informed pricing strategies. A powerful statistical method used to uncover this relationship is regression analysis. This article delves deep into regression analysis, explaining its application in identifying cost behavior, its various forms, the interpretation of results, and potential limitations.
Understanding Cost Behavior
Before diving into the statistical methods, it's crucial to understand the different types of cost behavior:
-
Fixed Costs: These costs remain constant regardless of the production volume or activity level. Examples include rent, insurance premiums, and salaries of administrative staff. They do not change with changes in production.
-
Variable Costs: These costs change directly and proportionally with changes in the production volume or activity level. Examples include direct materials, direct labor (in some cases), and sales commissions. Their total cost increases or decreases as production increases or decreases.
-
Mixed Costs (Semi-variable Costs): These costs have both fixed and variable components. A portion of the cost remains fixed, while another part varies with the activity level. Examples include utilities (a fixed monthly charge plus a variable charge based on usage) and maintenance costs (a fixed amount for routine maintenance plus variable costs for repairs). They exhibit a combination of fixed and variable cost characteristics.
Identifying the specific nature of each cost is vital for accurate cost prediction and management. This is where regression analysis proves invaluable.
Regression Analysis: Unveiling the Cost Behavior
Regression analysis is a powerful statistical technique used to model the relationship between a dependent variable (the cost) and one or more independent variables (the activity level or cost drivers). In the context of cost behavior analysis, it helps determine the fixed and variable components of mixed costs and estimate future costs based on predicted activity levels.
Simple Linear Regression: Analyzing the Relationship Between Two Variables
Simple linear regression is the most basic form, used when there's one independent variable influencing the dependent variable. The model is represented by the equation:
Y = a + bX
Where:
- Y is the dependent variable (total cost)
- X is the independent variable (activity level, e.g., units produced)
- a is the y-intercept (fixed cost) – the cost when the activity level is zero.
- b is the slope (variable cost per unit) – the change in cost for each unit change in the activity level.
The goal of simple linear regression is to find the values of 'a' and 'b' that best fit the data points. This is done using statistical methods such as the least squares method, which minimizes the sum of the squared differences between the actual costs and the costs predicted by the regression line.
Multiple Linear Regression: Accounting for Multiple Cost Drivers
When multiple independent variables influence the dependent variable (cost), multiple linear regression is employed. This allows for a more comprehensive understanding of cost behavior by incorporating several factors. The equation expands to:
Y = a + b₁X₁ + b₂X₂ + ... + bₙXₙ
Where:
- Y remains the dependent variable (total cost)
- X₁, X₂, ..., Xₙ are the independent variables (different activity levels or cost drivers).
- a is still the y-intercept (fixed cost).
- b₁, b₂, ..., bₙ are the slopes, representing the change in cost for each unit change in the respective independent variable, holding other variables constant.
Multiple linear regression is particularly useful in situations where cost is influenced by factors like machine hours, direct labor hours, material usage, and batch size. It offers a more nuanced and accurate picture of cost behavior than simple linear regression.
Interpreting Regression Results
Once the regression analysis is complete, the output provides crucial information about cost behavior:
-
R-squared (R²): This value indicates the goodness of fit of the regression model. It represents the proportion of the variation in the dependent variable (cost) that is explained by the independent variable(s). A higher R² (closer to 1) signifies a better fit, meaning the model accurately predicts cost behavior.
-
Adjusted R-squared: This is a modified version of R² that accounts for the number of independent variables in the model. It's crucial when comparing models with different numbers of independent variables, as adding more variables always increases R², even if they don't significantly improve the prediction.
-
Coefficients (a and b): These are the estimated values of the y-intercept (fixed cost, 'a') and the slope(s) (variable cost per unit, 'b'). These coefficients are statistically significant if their p-values are below a pre-determined significance level (e.g., 0.05).
-
P-values: These values assess the statistical significance of the coefficients. A low p-value (typically less than 0.05) suggests that the coefficient is statistically significant, meaning there's strong evidence that the independent variable has a real impact on the dependent variable.
-
Standard Error: This measures the variability of the regression coefficients. A smaller standard error indicates a more precise estimate of the coefficient.
Choosing the Right Regression Model
Selecting the appropriate regression model depends on several factors:
-
Nature of the data: The type and quality of data available significantly influence the choice of model. Outliers and non-linear relationships may necessitate alternative approaches.
-
Number of independent variables: The complexity of the cost behavior dictates the inclusion of multiple independent variables, leading to the use of multiple linear regression.
-
Assumptions of linear regression: Linear regression models rest on certain assumptions, such as linearity, independence of errors, constant variance of errors (homoscedasticity), and normality of errors. Violation of these assumptions might necessitate data transformation or the use of alternative models.
Limitations of Regression Analysis in Cost Behavior Analysis
While regression analysis is a powerful tool, it has certain limitations:
-
Data quality: The accuracy of the analysis hinges on the quality and reliability of the data. Inaccurate or incomplete data will lead to unreliable results.
-
Assumption violations: As mentioned earlier, violating the assumptions of linear regression can lead to biased or inefficient estimates.
-
Non-linear relationships: Regression analysis is best suited for linear relationships. If the relationship between cost and activity is non-linear, the model might not accurately capture the cost behavior. In such cases, non-linear regression techniques or data transformations might be necessary.
-
Outliers: Outliers in the data can heavily influence the regression results, leading to biased estimates. Identifying and handling outliers is crucial for obtaining reliable results.
-
Causation vs. Correlation: Regression analysis only establishes correlation, not causation. A strong correlation between cost and activity doesn't automatically imply that one causes the other. Other factors might be influencing both variables.
Beyond Simple and Multiple Linear Regression: Other Techniques
While simple and multiple linear regression are frequently used, other regression techniques can be valuable in specific situations:
-
Non-linear regression: If the relationship between cost and activity is not linear, non-linear regression models can be used. These models allow for more flexible relationships between the variables.
-
Stepwise regression: This technique automatically selects the most significant independent variables from a larger set, helping to avoid overfitting the model.
-
Ridge regression and Lasso regression: These techniques are useful when dealing with multicollinearity (high correlation between independent variables), which can destabilize the regression model.
Conclusion
Regression analysis is a powerful statistical method for identifying cost behavior. It allows businesses to accurately model the relationship between costs and activity levels, ultimately improving forecasting, budgeting, and pricing decisions. Understanding the different types of regression models, their interpretations, and their limitations is crucial for effective application. While simple and multiple linear regression provide a strong foundation, other techniques can be employed to address more complex scenarios. Always ensure that the assumptions of the chosen regression model are met, and be mindful of potential limitations in data quality and interpretation. Using regression analysis effectively allows businesses to gain valuable insights into their cost structures, leading to better resource allocation and enhanced profitability.
Latest Posts
Latest Posts
-
At What Point Are The Atria Repolarizing
Mar 28, 2025
-
The Foreign Purchases Effect On Aggregate Demand Suggests That A
Mar 28, 2025
-
Perfect Price Discrimination Is Mostly Hypothetical
Mar 28, 2025
-
To Be Valid An Economic Model Must
Mar 28, 2025
-
Veronica Manages A Team Of Medical Transcribers
Mar 28, 2025
Related Post
Thank you for visiting our website which covers about A Statistical Method For Identifying Cost Behavior Is Called . . We hope the information provided has been useful to you. Feel free to contact us if you have any questions or need further assistance. See you next time and don't miss to bookmark.
