Which Of The Following Is A Feature Of Power Query
Holbox
Mar 20, 2025 · 7 min read
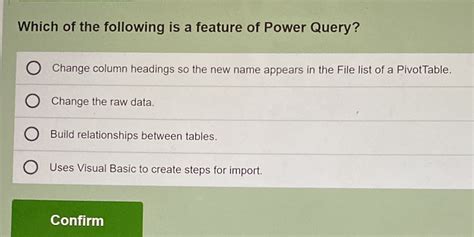
Table of Contents
Which of the following is a feature of Power Query? A Deep Dive into Data Transformation Capabilities
Power Query, now integrated into Microsoft Excel and Power BI, is a powerful data transformation tool that allows users to connect to, clean, transform, and load data from various sources. Understanding its features is key to leveraging its full potential. This article explores the core functionalities of Power Query, answering the implicit question: "Which of the following is a feature of Power Query?" by covering a broad range of its capabilities. We'll go beyond simple yes/no answers to provide a comprehensive understanding of how these features work and why they're crucial for data analysis.
Core Features of Power Query: Connecting, Cleaning, and Transforming Data
Power Query's strength lies in its ability to handle the entire data preparation process, from connecting to diverse data sources to delivering a refined, analysis-ready dataset. This process, often termed ETL (Extract, Transform, Load), is significantly streamlined by Power Query's intuitive interface and powerful functions.
1. Data Source Connectivity: The Foundation of Power Query
One of the most significant features of Power Query is its ability to connect to a wide array of data sources. This includes:
- Spreadsheets: Excel workbooks (.xlsx, .xls), CSV files, and other spreadsheet formats.
- Databases: SQL Server, Oracle, MySQL, Access, and many more relational databases.
- Cloud Services: Azure SQL Database, Google BigQuery, Salesforce, and other cloud-based platforms.
- Web Data: Data from websites via web connectors, enabling the extraction of information from HTML tables and APIs.
- Text and XML Files: Power Query effortlessly handles various structured and semi-structured text formats.
- JSON Files: Import and parse JSON data for seamless integration into your analysis.
- Power BI Datasets: Connect directly to existing Power BI datasets for enhanced collaboration and data reuse.
This broad connectivity allows users to consolidate data from disparate sources, eliminating the need for manual data entry and reducing errors. The ease of connecting to these different data sources makes Power Query a highly versatile tool applicable across numerous industries and data-driven tasks.
2. Data Cleaning: Addressing Inconsistent and Incomplete Data
Raw data is rarely perfect. Power Query offers a robust suite of tools to clean and prepare your data for analysis:
- Removing Duplicates: Identify and eliminate duplicate rows based on specific columns, ensuring data accuracy.
- Handling Missing Values: Employ various techniques to fill in missing values, like imputation with mean, median, or custom values, or removing rows with missing data entirely.
- Data Type Conversion: Easily change data types (e.g., text to number, date to text) to ensure data consistency and compatibility with analytical functions.
- Filtering Rows: Select specific rows based on criteria, allowing you to focus on relevant data subsets.
- Column Transformation: Rename, remove, reorder, or split columns to match your analytical needs. This includes splitting columns by delimiter or based on position.
- Advanced Filtering and Conditional Logic: Use advanced filtering options, including filter rows based on multiple conditions or using custom expressions based on M-language.
These data cleaning features significantly reduce the time spent on manual data cleaning, allowing analysts to focus on insights rather than data preparation. The ability to apply these transformations easily and repeatedly across various datasets is a hallmark of Power Query's efficiency.
3. Data Transformation: Shaping Data for Analysis
Once cleaned, data often requires further transformation to fit the requirements of analysis. Power Query provides extensive transformation capabilities:
- Adding Custom Columns: Create new columns based on calculations, transformations, or existing column values.
- Merging Queries: Combine data from multiple queries based on common columns, enabling integrated analysis across different datasets.
- Appending Queries: Stack multiple queries on top of each other, creating a consolidated dataset from similar data sources.
- Pivot and Unpivot Columns: Transform data from a wide to a long format or vice-versa, adapting data structure for analysis.
- Grouping and Aggregating Data: Group data by specific columns and calculate aggregations (sum, average, count, etc.) for each group.
- Conditional Column Creation: Create columns based on conditional logic (IF-THEN-ELSE statements) to categorize and manipulate data.
- Text Transformation: Uppercase/Lowercase conversion, trimming spaces, extracting substrings, replacing text – all crucial for text data manipulation.
- Date/Time Transformations: Extract year, month, day, or other time components from date/time data.
These transformation features enable users to reshape data to align with their analytical goals, making it easier to perform calculations, build visualizations, and extract meaningful insights.
Power Query's Advanced Features: Unleashing the Power of M
Power Query utilizes a powerful formula language called M (pronounced "M"). While the graphical interface handles many common tasks, M provides advanced capabilities for customization and automation:
1. M Language: Advanced Data Transformation and Customization
Understanding the M language unlocks the true potential of Power Query. M allows users to create custom functions, automate complex transformations, and extend Power Query's capabilities beyond the built-in functions.
- Custom Functions: Build reusable functions for repetitive tasks, streamlining the data transformation process.
- Advanced Data Manipulation: Perform sophisticated transformations using M's powerful operators and functions.
- Integration with Other Systems: Connect to APIs and external data sources through custom M code.
- Error Handling: Implement robust error handling mechanisms to ensure data quality and prevent process interruptions.
The M language empowers users to solve complex data manipulation problems and create highly customized data pipelines. While not strictly necessary for basic data transformation, mastering M is crucial for advanced users seeking maximum control and automation.
2. Data Profiling and Analysis: Understanding Your Data
Power Query offers data profiling capabilities that help you understand the characteristics of your data before and after transformations:
- Data Type Detection: Power Query automatically detects data types, but you can also explicitly define them.
- Data Quality Analysis: Identify potential data issues, such as inconsistencies or outliers.
- Data Preview: View a preview of the transformed data before loading it into your destination.
- Step-by-Step Transformation History: Track each step in the transformation process, allowing for easy debugging and modification.
These features are essential for data quality control, helping users identify and address potential issues before proceeding with analysis.
3. Query Management and Organization: Efficient Data Workflow
As you work with multiple data sources and transformations, managing your queries becomes important:
- Query Organization: Organize queries logically within the Power Query Editor.
- Query Comments: Add comments to your queries to improve readability and maintainability.
- Query Versioning (Implicit): Power Query retains a history of transformations, allowing you to revert to previous steps if necessary.
- Query Reuse: Utilize previously created queries in new projects, promoting efficient data workflow.
Efficient query management is critical for large projects, ensuring maintainability and reducing errors.
4. Data Load Options: Delivering Data to Your Destination
Finally, after cleaning and transforming the data, you need to load it to your destination:
- Load to Table: Load the data into an Excel table.
- Load to Data Model: Load the data into the Excel Data Model for advanced analysis and visualization.
- Load to PivotTable: Directly load data into a PivotTable for interactive analysis.
- Load to Power BI: Import the data into Power BI for creating interactive dashboards and reports.
This flexibility allows seamless integration with other Microsoft tools and platforms, maximizing the utility of your transformed data.
Conclusion: Power Query – A Comprehensive Data Transformation Solution
This deep dive into Power Query highlights its wide range of features, making it a powerful tool for anyone working with data. From its versatile data source connectivity to its advanced M language capabilities, Power Query empowers users to effectively clean, transform, and load data, ultimately leading to more efficient and insightful data analysis. Understanding these features is crucial for harnessing Power Query's potential and unlocking the value hidden within your data. The ability to handle diverse data types, implement complex transformations, and integrate seamlessly with other tools places Power Query at the forefront of modern data preparation solutions. Remember to explore and experiment with these features to fully grasp their capabilities and how they can streamline your data workflow.
Latest Posts
Latest Posts
-
A Patient Is Put On Medication At 20 Mg
Mar 21, 2025
-
An Account Is Said To Have A Debit Balance If
Mar 21, 2025
-
Classify The Radicals Into The Appropriate Categories
Mar 21, 2025
-
Two Spacecraft Are Following Paths In Space Given By
Mar 21, 2025
-
When Consumers Decide To Purchase A Particular Product They
Mar 21, 2025
Related Post
Thank you for visiting our website which covers about Which Of The Following Is A Feature Of Power Query . We hope the information provided has been useful to you. Feel free to contact us if you have any questions or need further assistance. See you next time and don't miss to bookmark.
