Which Is The Base Peak Chegg
Holbox
Mar 15, 2025 · 6 min read
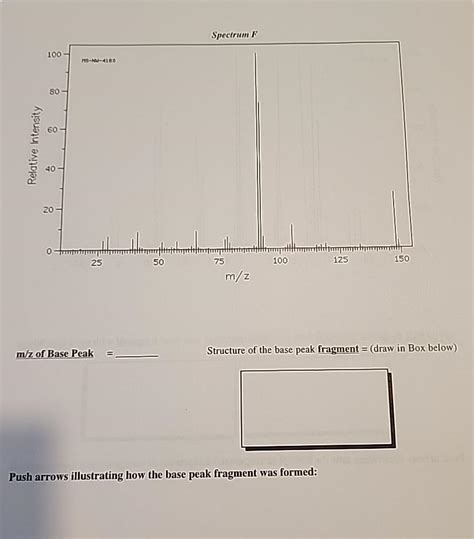
Table of Contents
Which is the Base Peak Chegg? Understanding Mass Spectrometry and Base Peaks
Mass spectrometry (MS) is a powerful analytical technique used to determine the mass-to-charge ratio (m/z) of ions. This information is crucial in identifying unknown compounds, determining the elemental composition of molecules, and quantifying the abundance of different species in a sample. A key concept in interpreting mass spectrometry data is the base peak. Understanding what the base peak is, how it's identified, and its significance is essential for anyone working with mass spectrometry data, whether in a research lab or educational setting like Chegg.
What is the Base Peak in Mass Spectrometry?
The base peak in a mass spectrum is simply the most abundant ion. It's the tallest peak in the spectrum and is assigned a relative abundance of 100%. All other peaks in the spectrum are then expressed as a percentage of the base peak's intensity. This normalization makes comparing different mass spectra much easier, regardless of the overall intensity of the ionization process.
Think of it like this: Imagine you're counting different colored marbles in a jar. The base peak would be the color of marble you have the most of. All other colors would be reported as a percentage relative to the most abundant color.
Why is the Base Peak Important?
The base peak provides several crucial pieces of information:
-
Structural Information: The mass-to-charge ratio (m/z) of the base peak often indicates a stable fragment ion, which can provide valuable insights into the structure of the original molecule. This is particularly useful in identifying unknown compounds.
-
Comparison and Identification: The base peak, along with other significant peaks, forms a unique "fingerprint" for a molecule. This "fingerprint" can be compared to known spectral databases to identify the compound.
-
Quantitative Analysis: While not the primary purpose, the relative abundance of the base peak can be used in quantitative analysis, although other methods are typically more accurate for precise quantification.
-
Instrumentation Assessment: The base peak's intensity can indirectly reflect the performance and sensitivity of the mass spectrometer. A consistently low-intensity base peak might indicate a problem with the instrument.
Identifying the Base Peak on a Mass Spectrum
Identifying the base peak on a mass spectrum is straightforward:
-
Locate the Tallest Peak: Simply look for the peak with the highest intensity in the spectrum. This peak represents the most abundant ion.
-
Check the Relative Abundance: The relative abundance of the base peak is always 100%. Other peaks' abundances are expressed as a percentage relative to this value.
-
Note the m/z Value: Record the m/z value (mass-to-charge ratio) of the base peak. This value is crucial for structural interpretation and compound identification.
Examples of Base Peaks and Their Significance
It's impossible to provide a single definitive answer to "which is the base peak Chegg?" because the base peak varies drastically depending on the molecule being analyzed. The base peak is not a fixed value related to a specific platform or resource like Chegg; it's entirely dependent on the chemical properties of the substance under investigation. However, we can illustrate the concept with hypothetical examples:
Example 1: A Simple Alkane
Let's say we are analyzing a simple alkane like octane (C₈H₁₈). The molecular ion (M⁺) might have a relatively low abundance, but fragmentation will produce several fragment ions. A common base peak might correspond to a relatively stable alkyl fragment, perhaps a propyl or butyl cation (m/z values would depend on the specific fragmentation pathway).
Example 2: An Aromatic Compound
An aromatic compound, like toluene, often shows a strong base peak corresponding to the molecular ion (M⁺) itself due to the stability of the aromatic ring. However, fragmentation might also lead to significant peaks. The precise base peak will depend on the ionization conditions and the instrument's settings.
Example 3: A Peptide
Analyzing a peptide using MS will lead to a complex spectrum. The base peak might correspond to a specific fragment ion formed by cleavage of the peptide backbone, depending on the amino acid sequence and the fragmentation techniques utilized (e.g., CID, ETD). Predicting the base peak without knowing the peptide sequence is difficult.
Factors Affecting Base Peak Selection
Several factors influence which ion becomes the base peak:
-
Molecular Structure: The structure of the molecule dictates the fragmentation pathways and the stability of resulting fragment ions. More stable ions will be more abundant.
-
Ionization Technique: Different ionization methods (e.g., electron ionization (EI), chemical ionization (CI), electrospray ionization (ESI)) lead to different fragmentation patterns, impacting the base peak.
-
Instrument Parameters: Parameters like the energy of the electron beam (in EI), the collision energy (in tandem MS), and the temperature can also affect fragmentation and, thus, the base peak.
-
Sample Purity: Impurities in the sample can affect the relative abundance of ions, potentially altering the base peak.
Beyond the Base Peak: Interpreting the Entire Mass Spectrum
While the base peak is a crucial piece of information, interpreting a mass spectrum requires analyzing the entire spectrum, not just the base peak. The presence of other significant peaks, their relative abundances, and their m/z values provide additional information needed for structural elucidation and compound identification.
Consider the following aspects:
-
Molecular Ion Peak (M⁺): The peak corresponding to the molecular ion provides the molecular weight of the compound.
-
Isotope Peaks: The presence of isotope peaks (e.g., ¹³C instead of ¹²C) can confirm the elemental composition of the molecule.
-
Fragment Ion Peaks: The pattern of fragment ion peaks provides information about the molecule's structure and bonding.
-
Characteristic Fragmentation Patterns: Certain functional groups exhibit characteristic fragmentation patterns, which aid in identifying the structure.
Chegg and Mass Spectrometry: A Learning Perspective
Chegg, as an online learning platform, offers various resources, including study guides and practice problems, that can help students understand mass spectrometry and base peak identification. While Chegg won't directly tell you which ion is the base peak for a specific compound without providing the mass spectrum itself, it serves as a valuable resource for learning the fundamentals and interpreting mass spectrometry data.
Utilizing Chegg's resources can enhance understanding through:
-
Conceptual Explanations: Chegg provides explanations of the underlying principles of mass spectrometry.
-
Solved Problems: Working through solved problems provides practice in identifying the base peak and interpreting mass spectra.
-
Interactive Tools: Certain Chegg resources may incorporate interactive tools that help visualize and analyze mass spectral data.
Remember that understanding mass spectrometry is a process that requires practice and a good grasp of the underlying chemical principles. Chegg, along with other learning tools, can contribute to this process.
Conclusion
The base peak is the most abundant ion in a mass spectrum, providing valuable information for identifying unknown compounds and gaining structural insights. However, the base peak's identity is unique to each molecule and depends on its structure, ionization method, and instrument parameters. Interpreting a mass spectrum requires analyzing the whole spectrum rather than focusing solely on the base peak. Platforms like Chegg can provide valuable educational resources to support learning and mastering this essential analytical technique. Therefore, instead of searching for a specific "base peak Chegg," focus on understanding the concepts and principles to successfully interpret mass spectrometry data.
Latest Posts
Latest Posts
-
When Should The Project Manager Prepare The Final Report Chegg
Mar 15, 2025
-
The Capital Expenditures Budget Reports Expected
Mar 15, 2025
-
Thermostatic Expansion Valves Respond To Changes In
Mar 15, 2025
-
Capital Budgeting Decisions Usually Involve Analysis Of
Mar 15, 2025
-
Each Ics General Staff Is Led By
Mar 15, 2025
Related Post
Thank you for visiting our website which covers about Which Is The Base Peak Chegg . We hope the information provided has been useful to you. Feel free to contact us if you have any questions or need further assistance. See you next time and don't miss to bookmark.
