The Purpose Of Control Charts Is To
Holbox
Mar 21, 2025 · 6 min read
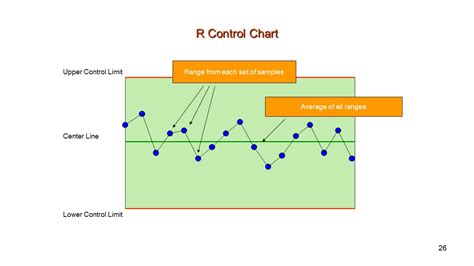
Table of Contents
- The Purpose Of Control Charts Is To
- Table of Contents
- The Purpose of Control Charts Is To: Monitor Process Stability and Improve Quality
- Understanding Variation: The Foundation of Control Charts
- The Primary Purposes of Control Charts
- 1. Monitoring Process Stability: Identifying Out-of-Control Situations
- 2. Distinguishing Between Common and Special Cause Variation
- 3. Reducing Variability and Improving Quality
- 4. Providing a Visual Record of Process Performance
- 5. Facilitating Continuous Improvement
- Types of Control Charts: Choosing the Right Tool
- Implementing Control Charts Effectively: Key Considerations
- Conclusion: The Power of Proactive Quality Management
- Latest Posts
- Latest Posts
- Related Post
The Purpose of Control Charts Is To: Monitor Process Stability and Improve Quality
Control charts, a cornerstone of statistical process control (SPC), serve a critical purpose: to monitor process stability and improve quality. They achieve this by visually displaying data collected from a process over time, allowing for easy identification of patterns, trends, and anomalies that indicate potential problems. Understanding the purpose of control charts goes beyond simply plotting data; it involves proactively managing variation, preventing defects, and driving continuous improvement.
Understanding Variation: The Foundation of Control Charts
Before delving into the specific purposes, it's crucial to grasp the concept of variation. In any process, variation is inevitable. Some variation is inherent to the process itself (common cause variation), while other variation stems from assignable causes (special cause variation). The key objective of control charts is to distinguish between these two types of variation.
-
Common Cause Variation: This is the inherent, natural variation within a process. It's the background noise, the small fluctuations expected within the system's normal operating parameters. Think of the slight differences in weight between individually produced cookies, even when following the same recipe. This variation is usually predictable and stable.
-
Special Cause Variation: This is variation caused by identifiable factors outside the normal operating parameters. These factors could be machine malfunctions, changes in raw materials, operator errors, or environmental changes. Imagine a sudden spike in cookie weight due to a malfunctioning oven. This variation is unpredictable and unstable.
The Primary Purposes of Control Charts
Control charts serve several key purposes, all contributing to improved quality and process efficiency:
1. Monitoring Process Stability: Identifying Out-of-Control Situations
The most fundamental purpose of a control chart is to detect shifts or changes in process performance. By visually representing data points over time, control charts make it easy to identify points that fall outside the established control limits. These points signal potential problems—that is, special cause variation—requiring investigation and corrective action. This proactive approach minimizes the risk of producing non-conforming products or services.
Key Aspects of Monitoring Stability:
-
Early Detection of Problems: Control charts provide a timely warning of deviations from the desired process performance. This early detection is critical for minimizing waste and preventing larger-scale issues.
-
Objective Assessment of Process Performance: They offer an objective and unbiased way to evaluate process performance, based on data rather than subjective opinions.
-
Data-Driven Decision Making: Control charts provide the data necessary for informed decisions about process adjustments or improvements.
2. Distinguishing Between Common and Special Cause Variation
As mentioned earlier, a crucial function of control charts is the differentiation between common and special cause variation. Identifying special cause variation allows for focused corrective actions, addressing the root cause of the problem and preventing its recurrence. Ignoring special cause variation risks implementing unnecessary changes or, worse, letting the problem persist and worsen.
The Importance of Distinction:
-
Targeted Improvements: Understanding the source of variation directs improvement efforts towards the specific cause, leading to more effective and efficient solutions.
-
Avoiding Unnecessary Changes: By distinguishing between common and special cause variation, unnecessary adjustments to the process are avoided, maintaining stability and efficiency.
-
Process Optimization: Effective identification of special causes leads to process optimization and reduced variability.
3. Reducing Variability and Improving Quality
By identifying and addressing special causes of variation, control charts directly contribute to reduced process variability and improved product/service quality. Less variation means more consistent output, meeting customer expectations and minimizing defects. This, in turn, leads to improved customer satisfaction, reduced costs associated with rework or scrap, and enhanced profitability.
Impact on Quality:
-
Consistent Output: Reduced variability leads to more consistent product or service quality, fulfilling customer requirements reliably.
-
Defect Reduction: Identifying and eliminating special cause variation minimizes defects and non-conforming outputs.
-
Enhanced Customer Satisfaction: Consistent, high-quality output directly translates to higher customer satisfaction and loyalty.
4. Providing a Visual Record of Process Performance
Control charts offer a clear and concise visual representation of process performance over time. This historical data is invaluable for tracking progress, evaluating the effectiveness of improvements, and identifying trends. This visual record allows for easier communication of process performance to stakeholders, facilitating collaboration and informed decision-making.
Benefits of Visual Records:
-
Trend Analysis: Visual representation allows easy identification of trends and patterns, facilitating proactive adjustments.
-
Improved Communication: Charts provide a clear, easily understandable way to communicate process performance to different stakeholders.
-
Continuous Improvement Tracking: The historical data allows for monitoring the effectiveness of implemented improvements over time.
5. Facilitating Continuous Improvement
Control charts are not merely monitoring tools; they are powerful instruments for driving continuous improvement. By continually monitoring the process and identifying areas for improvement, control charts facilitate a culture of proactive problem-solving and ongoing optimization. This iterative process of improvement leads to greater efficiency, reduced waste, and consistently higher quality output.
Continuous Improvement Through Control Charts:
-
Proactive Problem Solving: Early detection of problems through control charts enables proactive intervention, preventing escalation of issues.
-
Data-Driven Improvement: Data from control charts informs improvement efforts, allowing for targeted and effective solutions.
-
Culture of Continuous Improvement: Control charts foster a culture where continuous improvement is valued and actively pursued.
Types of Control Charts: Choosing the Right Tool
Several types of control charts exist, each designed for different data types and applications. The choice of control chart depends on the nature of the data being collected and the specific goals of the monitoring process. Some common types include:
-
X-bar and R chart: Used for monitoring the average (X-bar) and range (R) of continuous data. Suitable for variables data, such as weight, length, or temperature.
-
X-bar and s chart: Similar to X-bar and R chart, but uses the standard deviation (s) instead of the range. Preferred when dealing with larger sample sizes.
-
p-chart: Used for monitoring the proportion of non-conforming units in a sample. Appropriate for attribute data, such as the number of defective items.
-
c-chart: Used for monitoring the number of defects per unit. Also suitable for attribute data.
-
u-chart: Used for monitoring the number of defects per unit when the sample size varies.
Choosing the appropriate control chart is crucial for accurate interpretation and effective process monitoring.
Implementing Control Charts Effectively: Key Considerations
Effective implementation of control charts requires careful planning and execution. Key considerations include:
-
Define the Process: Clearly define the process being monitored, including the specific variables being measured.
-
Establish Control Limits: Determine appropriate control limits based on historical data or industry standards.
-
Collect Data Consistently: Gather data systematically and consistently, ensuring accuracy and reliability.
-
Investigate Out-of-Control Points: Thoroughly investigate any points falling outside the control limits to identify and address the root cause.
-
Document Results: Maintain detailed records of data collected, investigations conducted, and corrective actions taken.
-
Regular Review: Regularly review the control charts to track progress and identify any emerging trends or problems.
Conclusion: The Power of Proactive Quality Management
The purpose of control charts is far more profound than simply plotting data points. They are a powerful tool for proactive quality management, enabling organizations to monitor process stability, identify and address problems, reduce variability, and drive continuous improvement. By understanding the underlying principles and effectively implementing control charts, organizations can significantly enhance their ability to produce high-quality products and services while maximizing efficiency and minimizing waste. The investment in implementing a robust control chart system pays dividends in improved quality, enhanced customer satisfaction, and increased profitability. Control charts are not just a tool; they are a philosophy—a commitment to ongoing monitoring, improvement, and excellence.
Latest Posts
Latest Posts
-
Consider The Acid Catalyzed Hydration Of 3 Methyl 1 Butene
Mar 28, 2025
-
Zaras Implements Limited Production Runs To
Mar 28, 2025
-
Consider The Circuit Diagram Depicted In The Figure
Mar 28, 2025
-
Can Mutations Show Convergent Evolution Worksheet Answer Key
Mar 28, 2025
-
Study The Series Of Pictures To Identify The Process As
Mar 28, 2025
Related Post
Thank you for visiting our website which covers about The Purpose Of Control Charts Is To . We hope the information provided has been useful to you. Feel free to contact us if you have any questions or need further assistance. See you next time and don't miss to bookmark.
