The Least Squares Regression Line Minimizes The Sum Of The
Holbox
Mar 19, 2025 · 6 min read
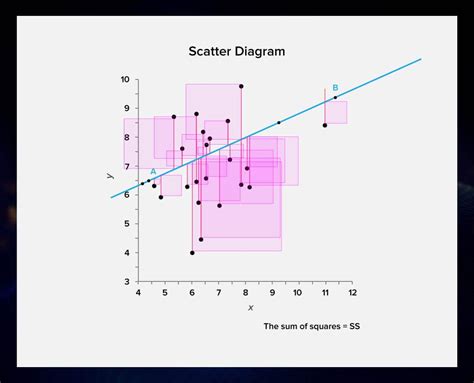
Table of Contents
The Least Squares Regression Line Minimizes the Sum of Squared Residuals
The least squares regression line is a fundamental concept in statistics and data analysis. It represents the best-fitting straight line through a set of data points, minimizing the sum of the squared differences between the observed values and the predicted values on the line. Understanding this principle is crucial for interpreting regression analyses and applying them effectively in various fields. This article delves deep into the concept, explaining its mathematical foundation, practical applications, and limitations.
Understanding Residuals
Before we dive into the minimization of squared residuals, let's define what a residual is. In regression analysis, a residual (also known as an error) is the difference between the observed value of the dependent variable (y) and the predicted value (ŷ) from the regression line. Mathematically, it's represented as:
Residual (e) = y - ŷ
A positive residual indicates that the observed value is above the regression line, while a negative residual suggests it's below the line. The goal of least squares regression is to find the line that minimizes the sum of these residuals, but not simply the sum, rather the sum of the squares of these residuals.
Why Squared Residuals?
You might wonder why we square the residuals instead of simply summing them. There are two crucial reasons:
-
Eliminating the effect of positive and negative residuals: Summing the residuals directly would lead to a cancellation effect. Positive and negative residuals could offset each other, even if the line is a poor fit. Squaring the residuals ensures that all values contribute positively to the sum, regardless of their sign.
-
Emphasis on larger errors: Squaring amplifies the impact of larger residuals. A residual of -5, when squared, becomes 25, while a residual of -1 becomes only 1. This weighting emphasizes the importance of reducing the larger errors, leading to a line that better fits the overall data.
The Least Squares Criterion
The least squares criterion states that the best-fitting regression line is the one that minimizes the sum of the squared residuals (SSR). Mathematically, this is represented as:
Minimize SSR = Σ(yᵢ - ŷᵢ)²
where:
- Σ denotes the sum over all data points.
- yᵢ is the observed value of the dependent variable for the i-th data point.
- ŷᵢ is the predicted value of the dependent variable for the i-th data point, calculated from the regression line.
This minimization problem is typically solved using calculus, by taking partial derivatives of the SSR with respect to the slope (b) and intercept (a) of the regression line and setting them equal to zero. This yields the normal equations, which can then be solved to find the values of 'a' and 'b' that minimize the SSR. The solutions are the formulas for the slope and intercept of the least squares regression line:
b = Σ[(xᵢ - x̄)(yᵢ - ȳ)] / Σ(xᵢ - x̄)²
a = ȳ - b * x̄
where:
- xᵢ and yᵢ are the individual data points.
- x̄ and ȳ are the means of the x and y values, respectively.
Geometric Interpretation of Least Squares
The least squares method can also be understood geometrically. Imagine each data point as a vector in a multi-dimensional space. The regression line represents a vector that is the best approximation (in terms of minimizing the Euclidean distance) of all the data points. The residuals are then the vectors connecting the data points to the regression line. The least squares method minimizes the sum of the squared lengths of these residual vectors.
Applications of Least Squares Regression
The least squares regression line has widespread applications across numerous fields, including:
1. Forecasting and Prediction:
- Sales Forecasting: Businesses use regression analysis to predict future sales based on historical data and other relevant factors.
- Financial Modeling: Predicting stock prices, interest rates, or other financial variables relies heavily on regression techniques.
- Weather Forecasting: Predicting temperature, rainfall, or other weather parameters often involves regression models.
2. Causal Inference:
While correlation does not imply causation, regression analysis can help to establish a potential causal relationship between variables, controlling for other factors. However, careful consideration of potential confounding variables is crucial.
3. Data Analysis and Exploration:
- Identifying Trends: Regression analysis helps identify underlying trends and patterns in data.
- Feature Selection: In machine learning, regression can help select the most relevant features for predicting a target variable.
- Outlier Detection: Large residuals can indicate outliers in the data.
4. Engineering and Science:
- Calibration: Least squares is used to calibrate instruments and sensors.
- Modeling Physical Processes: Regression models are used to represent the relationship between physical variables.
Limitations of Least Squares Regression
While powerful, the least squares regression line has several limitations:
-
Sensitivity to Outliers: Outliers can significantly influence the regression line, potentially distorting the results. Robust regression methods can be used to mitigate this issue.
-
Assumption of Linearity: The method assumes a linear relationship between the variables. If the relationship is non-linear, a transformation of the variables or a different model might be necessary.
-
Assumption of Independence: Least squares assumes that the residuals are independent of each other. Violation of this assumption can lead to biased estimates.
-
Assumption of Homoscedasticity: The method assumes that the variance of the residuals is constant across all values of the independent variable. Heteroscedasticity (non-constant variance) can affect the accuracy of the estimates.
-
Assumption of Normality: While not strictly required, the normality of the residuals can improve the statistical properties of the model.
-
Multicollinearity: In multiple regression (when there are multiple independent variables), high correlation between independent variables (multicollinearity) can make it difficult to interpret the individual effects of the variables.
Addressing Limitations: Robust Regression Techniques
Several techniques address the limitations of ordinary least squares regression, especially the sensitivity to outliers:
-
Robust Regression: Methods like RANSAC (Random Sample Consensus) and Theil-Sen estimator are less sensitive to outliers.
-
Weighted Least Squares: This method assigns different weights to the data points based on their reliability, giving less weight to outliers.
-
Non-linear Regression: If the relationship between variables is non-linear, non-linear regression models should be used.
-
Regularization Techniques: Methods like Ridge Regression and Lasso Regression can help prevent overfitting and improve model generalization.
Conclusion
The least squares regression line is a powerful tool for analyzing data and making predictions, providing a best-fit line that minimizes the sum of squared residuals. Understanding its underlying principles, applications, and limitations is essential for correctly interpreting results and selecting appropriate regression techniques for specific datasets and research questions. While the method possesses significant advantages, its limitations must be considered, and alternative methods employed when necessary. Remember to always check the assumptions underlying least squares regression before drawing conclusions from the results. By carefully considering these aspects, you can effectively leverage the power of least squares regression in your data analysis endeavors.
Latest Posts
Latest Posts
-
The Goal Of Any Marketing Communication Is To
Mar 19, 2025
-
Prepare An Income Statement For The Year Ended December 31
Mar 19, 2025
-
The Correct Name Of The Compound Ncl3 Is
Mar 19, 2025
-
If An Allocation Of Resources Is Efficient Then
Mar 19, 2025
-
The New Astm Standards For Footwear Specify That It Should
Mar 19, 2025
Related Post
Thank you for visiting our website which covers about The Least Squares Regression Line Minimizes The Sum Of The . We hope the information provided has been useful to you. Feel free to contact us if you have any questions or need further assistance. See you next time and don't miss to bookmark.
