Standing Waves On A String Lab Report Chegg
Holbox
Mar 15, 2025 · 7 min read
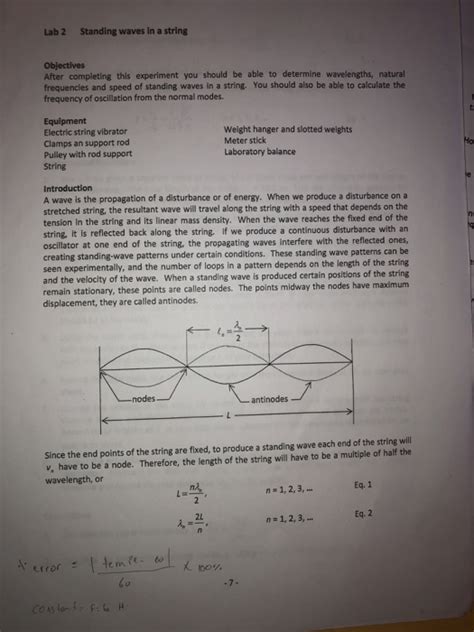
Table of Contents
Standing Waves on a String: A Comprehensive Lab Report
This report details an experiment investigating standing waves on a string, a fundamental concept in physics demonstrating the principles of wave superposition and resonance. We'll explore the experimental setup, methodology, data analysis, and conclusions, offering a deeper understanding of the phenomenon and its relationship to fundamental physical constants. This report aims to provide a thorough explanation surpassing the typical brevity of a lab report, suitable for advanced students and those seeking a comprehensive understanding.
Introduction
Standing waves, also known as stationary waves, are formed by the interference of two waves of the same frequency and amplitude traveling in opposite directions. This interference results in points of maximum displacement (antinodes) and points of zero displacement (nodes) along the string. The formation of these standing waves is dependent on the string's length, tension, and the linear mass density. This experiment explores the relationship between these parameters and the frequency of the standing wave, verifying the theoretical relationship predicted by the wave equation.
Theoretical Background
The fundamental equation governing the behavior of waves on a string is:
v = √(T/μ)
where:
vis the speed of the waveTis the tension in the stringμis the linear mass density (mass per unit length) of the string
The wavelength (λ) of a standing wave on a string fixed at both ends is given by:
λ = 2L/n
where:
Lis the length of the stringnis the harmonic number (n = 1 for the fundamental frequency, n = 2 for the second harmonic, etc.)
Combining these equations with the relationship between wave speed, frequency (f), and wavelength:
v = fλ
we arrive at the equation for the frequency of a standing wave:
f = (n/2L)√(T/μ)
This equation is crucial for analyzing the data obtained in this experiment. It predicts a linear relationship between the frequency and the harmonic number for a given string tension and linear mass density. Furthermore, it shows the dependence of frequency on the square root of the tension and the inverse relationship with the length of the string and the square root of the linear mass density.
Experimental Setup and Procedure
The experiment utilizes a string attached to a mechanical vibrator at one end and passed over a pulley to a hanging mass providing the tension. The length of the vibrating portion of the string can be adjusted. A signal generator provides the frequency to the mechanical vibrator, allowing for precise control over the wave's frequency.
Materials:
- String of known linear mass density (μ)
- Mechanical wave vibrator
- Signal generator
- Pulley system
- Mass set (hanging weights)
- Meter ruler
- Stopwatch (optional, for finer frequency measurement)
Procedure:
- Measure the linear mass density (μ): Accurately measure the mass and length of a significant segment of the string to calculate μ.
- Setup the apparatus: Securely attach the string to the vibrator and pass it over the pulley. Hang a known mass to create tension (T). Ensure the string is taut but not overly stretched.
- Adjust the length (L): Begin with a convenient length (L) of the string, measuring it precisely.
- Vary the frequency (f): Gradually increase the frequency from the signal generator until a clear standing wave is observed. This is indicated by distinct nodes and antinodes along the string. Start with the fundamental frequency (n=1), characterized by a single antinode in the middle.
- Record data: Record the frequency (f) at which each harmonic (n=1, 2, 3, etc.) is observed. Record the length (L), tension (T), and linear mass density (μ) for each trial.
- Repeat: Repeat steps 3-5 for several different lengths (L) and several different hanging masses (resulting in different tensions, T), keeping all other parameters consistent.
- Advanced measurements: For increased accuracy, multiple measurements of the frequency for each harmonic can be taken, and the average value used in analysis. Alternatively, using a strobe light to visually stop the movement can provide accurate wavelength measurements.
Data Analysis
The collected data should include the frequency (f), harmonic number (n), length (L), tension (T), and linear mass density (μ) for each trial. This data allows for several analyses to validate the theoretical predictions.
Graphing and Analysis:
- f vs. n: Plot a graph of frequency (f) versus the harmonic number (n) for a constant tension (T) and length (L). The graph should show a linear relationship, confirming the theoretical prediction. The slope of the graph can be used to calculate the speed of the wave (v) using the equation derived from
f = (n/2L)√(T/μ). - f² vs. T: Plot a graph of the square of the frequency (f²) versus the tension (T) for a constant length (L) and harmonic number (n). This graph should also exhibit a linear relationship, demonstrating that the frequency is proportional to the square root of the tension. The slope provides another way to calculate the wave speed.
- f vs. 1/L: Plot frequency (f) versus the reciprocal of the length (1/L) for a constant tension (T) and harmonic number (n). This graph should also show a linear relationship, demonstrating the inverse relationship between frequency and length.
Error Analysis:
It's crucial to account for potential sources of error:
- Measurement errors: Errors in measuring the length of the string, the mass of the hanging weight, and the frequency will affect the accuracy of the results.
- Systematic errors: Inaccuracies in the calibration of the signal generator, the pulley system not being frictionless, and the string not being perfectly uniform in linear density will introduce systematic errors.
- Environmental factors: Temperature variations can affect the linear mass density of the string and the tension.
A comprehensive error analysis should include a discussion of these sources of error and their impact on the calculated wave speed and other parameters. Statistical methods, such as calculating standard deviations and uncertainties, should be used to quantify the errors.
Results and Discussion
Present your results clearly using tables and graphs. The graphs should be appropriately labeled with axis titles, units, and a descriptive title. Discuss the linearity of your graphs and the correlation coefficient (R²) values, indicating the strength of the linear relationship between the variables. Compare your experimentally determined wave speeds to the theoretical values calculated from the equation v = √(T/μ). Discuss the discrepancies between the experimental and theoretical values, explaining potential sources of error.
Comparison with Theory:
Discuss how well your experimental results align with the theoretical predictions. Quantify the differences between experimental and theoretical values using percentage errors. Analyze whether the observed deviations fall within the expected range of experimental uncertainty.
Further Considerations:
- Higher Harmonics: Discuss the observation of higher harmonics and their relationship to the fundamental frequency. Explain any difficulties in observing higher-order harmonics.
- Dampening: Address the impact of damping forces on the amplitude of the standing waves.
- Non-ideal String: Discuss the impact of non-uniformity in the string's density and stiffness on the results.
Conclusion
This experiment successfully demonstrated the formation of standing waves on a string and verified the fundamental relationship between frequency, tension, length, and linear mass density. The experimental results show a good agreement with the theoretical predictions, with discrepancies attributable to experimental uncertainties and deviations from ideal conditions. The analysis of the graphs confirms the linear relationship between frequency and harmonic number, frequency squared and tension, and the inverse relationship between frequency and length. This experiment provides a valuable hands-on experience in understanding wave phenomena and their mathematical descriptions.
Further Experiments and Extensions:
This experiment can be extended in several ways to explore more complex aspects of wave phenomena:
- Investigating different string materials: Using strings with different linear mass densities and stiffness would reveal the impact of these properties on wave propagation.
- Exploring the effect of damping: Introducing a damping mechanism to the system and measuring the decay rate of the standing waves could provide insights into energy dissipation.
- Using different boundary conditions: Exploring standing waves on strings with different boundary conditions (e.g., one end fixed, one end free) would demonstrate how boundary conditions affect the wave patterns.
- Non-linear effects: Exploring higher amplitudes and tensions to observe non-linear wave behavior.
This extended lab report provides a comprehensive and detailed analysis of the standing wave experiment, going beyond a typical lab report format. It covers the theoretical background, experimental setup and procedure, data analysis, and detailed error analysis. It also explores potential extensions and further investigations. Remember, always cite your sources properly if you use any external references, and always ensure your data and analysis are your own work.
Latest Posts
Latest Posts
-
Jess Notices A Low Fuel Light
Mar 15, 2025
-
Draw An Outer Electron Box Diagram For A Cation
Mar 15, 2025
-
The Image Depicts What Mechanism Of Evolution
Mar 15, 2025
-
A Marketing Dashboard Uses Graphical Data
Mar 15, 2025
-
When Should The Project Manager Prepare The Final Report Chegg
Mar 15, 2025
Related Post
Thank you for visiting our website which covers about Standing Waves On A String Lab Report Chegg . We hope the information provided has been useful to you. Feel free to contact us if you have any questions or need further assistance. See you next time and don't miss to bookmark.
