Draw The Shear And Moment Diagrams For The Cantilevered Beam
Holbox
Mar 16, 2025 · 7 min read
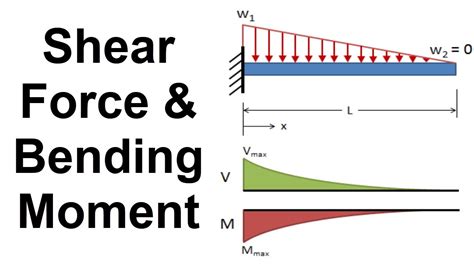
Table of Contents
Drawing Shear and Moment Diagrams for Cantilevered Beams: A Comprehensive Guide
Cantilever beams, fixed at one end and free at the other, are fundamental structural elements frequently encountered in engineering design. Understanding how to accurately draw their shear and moment diagrams is crucial for ensuring structural integrity and preventing failure. This comprehensive guide will walk you through the process, covering various loading scenarios and providing detailed explanations to solidify your understanding.
Understanding Shear and Moment
Before diving into the diagrams, let's establish a clear understanding of shear force and bending moment.
Shear Force (V)
Shear force represents the internal force acting parallel to the cross-section of the beam. It's the result of unbalanced vertical forces acting on either side of the section. A positive shear force is typically defined as one that causes the beam to shear upwards on the left side of a section. Conversely, a negative shear force causes downward shearing on the left side. In simpler terms, imagine trying to cut the beam; the shear force resists this cutting action.
Bending Moment (M)
Bending moment represents the internal moment that causes the beam to bend. It's the sum of the moments of all forces acting on one side of a section. A positive bending moment is defined as causing compression on the top of the beam and tension at the bottom (for beams bending downwards). A negative bending moment produces the opposite effect. Think of bending a ruler; the bending moment is the resistance to this bending.
Methodology for Drawing Shear and Moment Diagrams
The process generally involves these steps:
-
Draw the Free Body Diagram (FBD): This is the crucial first step. Accurately represent all external forces (loads, reactions) acting on the beam. For a cantilevered beam, the fixed end will have both a vertical reaction force (R<sub>y</sub>) and a moment reaction (M<sub>R</sub>).
-
Calculate Reactions: Use equilibrium equations (ΣF<sub>y</sub> = 0 and ΣM = 0) to solve for the unknown reactions (R<sub>y</sub> and M<sub>R</sub>) at the fixed end.
-
Determine Shear Force (V): Move along the beam section by section. At each section:
- Start with the reaction force at the fixed end.
- Add or subtract the vertical forces encountered along the beam. A downward force decreases shear, while an upward force increases it. This cumulative effect gives you the shear force at that section.
-
Determine Bending Moment (M): Again, moving along the beam:
- Start with the moment reaction at the fixed end.
- Consider the moments of all forces encountered up to that section. A downward force creates a negative moment contribution, while an upward force adds a positive moment contribution. The cumulative moment gives the bending moment at the section. Remember that the moment arm is the distance from the force to the section.
-
Plot the Diagrams: Plot the calculated shear forces (V) and bending moments (M) against the beam length (x). This forms the shear and moment diagrams.
Example Scenarios and Diagram Construction
Let's illustrate the process with various loading conditions:
1. Concentrated Point Load at the Free End
Imagine a cantilever beam of length 'L' with a concentrated point load 'P' at the free end.
1. FBD: Show the beam, the point load 'P' at the free end, and the reactions R<sub>y</sub> (upward) and M<sub>R</sub> (counter-clockwise) at the fixed end.
2. Reactions:
- ΣF<sub>y</sub> = 0 => R<sub>y</sub> - P = 0 => R<sub>y</sub> = P
- ΣM (at fixed end) = 0 => M<sub>R</sub> - PL = 0 => M<sub>R</sub> = PL
3. Shear Force:
- At x = 0 (fixed end): V = R<sub>y</sub> = P
- At x = L (free end): V = 0 (Since no more force encountered)
4. Bending Moment:
- At x = 0: M = M<sub>R</sub> = P*L
- At x = L: M = 0
5. Diagrams: The shear diagram will be a horizontal line at P from x=0 to x=L, then dropping to 0 at the free end. The bending moment diagram will be a straight line sloping from P*L at the fixed end to 0 at the free end.
2. Uniformly Distributed Load (UDL)
Consider a cantilever beam with a uniformly distributed load 'w' (force per unit length) over its entire length 'L'.
1. FBD: Show the beam, the UDL 'w' acting along its length, and reactions R<sub>y</sub> and M<sub>R</sub> at the fixed end.
2. Reactions:
- ΣF<sub>y</sub> = 0 => R<sub>y</sub> - wL = 0 => R<sub>y</sub> = wL
- ΣM (at fixed end) = 0 => M<sub>R</sub> - (wL)(L/2) = 0 => M<sub>R</sub> = (w*L<sup>2</sup>)/2
3. Shear Force:
- At x = 0: V = w*L
- At x = L: V = 0 (The shear force varies linearly from w*L to 0 along the beam) The equation for shear force is V(x) = wL - wx
4. Bending Moment: The bending moment varies parabolically. The equation for bending moment is M(x) = (wL<sup>2</sup>)/2 - (wx<sup>2</sup>)/2. At x=0, M = (wL<sup>2</sup>)/2, and at x=L, M = 0
5. Diagrams: The shear diagram is a straight line sloping downwards from wL at the fixed end to 0 at the free end. The moment diagram is a parabola starting at (wL<sup>2</sup>)/2 at the fixed end and reaching 0 at the free end.
3. Combination of Loads
Real-world scenarios often involve combinations of point loads and UDLs. The process remains the same; you'll just need to add or subtract the contributions of each load to the shear and bending moment calculations at each section.
Advanced Considerations
- Sign Conventions: Adhering to consistent sign conventions is paramount. While the examples use a particular convention, it's essential to understand and maintain the consistency chosen.
- Concentrated Moments: If the beam is subjected to concentrated moments, they are directly added to or subtracted from the bending moment at the point of application.
- Multiple Supports: The principles extend to beams with multiple supports (though the analysis becomes more complex).
- Software Tools: Engineering software packages significantly ease the process of generating shear and moment diagrams for complex scenarios. While manual calculation reinforces understanding, tools can be invaluable for large-scale projects.
- Influence Lines: For moving loads, influence lines are useful to determine the maximum shear and moment at a given point along the beam.
Significance of Shear and Moment Diagrams
Accurate shear and moment diagrams are pivotal for several reasons:
- Structural Design: They provide essential data for determining the required section dimensions to ensure the beam's strength and prevent failure. Engineers use these diagrams to select appropriate materials and sizes.
- Stress Analysis: The diagrams allow for determining the stresses (bending stress and shear stress) induced in the beam under the given loading condition. This is critical for designing a safe and robust structure.
- Deflection Analysis: While not directly derived from shear and moment diagrams, they are instrumental in calculating beam deflections using methods like the double integration method or moment-area methods.
- Failure Prediction: By analyzing the diagrams, potential points of high stress and bending are identified, which are critical failure locations. This allows for preventive measures or design adjustments.
Conclusion
Drawing shear and moment diagrams for cantilevered beams is a fundamental skill in structural engineering. Mastering this technique ensures accurate structural design and analysis, ultimately leading to safer and more efficient structures. This detailed guide, with its illustrative examples, has provided a comprehensive understanding of the process. Remember to always start with a carefully drawn free body diagram, meticulously calculate reactions, and carefully follow sign conventions for accurate and reliable results. With practice, you'll gain proficiency in creating these diagrams for even the most complex loading conditions.
Latest Posts
Latest Posts
-
Utma Accounts Are Opened Under The Tax Id Of The
Mar 17, 2025
-
In Which Situations Can Simplifying Jobs Be Most Beneficial
Mar 17, 2025
-
For The Hr Planning Process How Should Goals Be Determined
Mar 17, 2025
-
How Does A Shortcut Link To Another File
Mar 17, 2025
-
Cash Flows From Financing Activities Do Not Include
Mar 17, 2025
Related Post
Thank you for visiting our website which covers about Draw The Shear And Moment Diagrams For The Cantilevered Beam . We hope the information provided has been useful to you. Feel free to contact us if you have any questions or need further assistance. See you next time and don't miss to bookmark.
