Why Are T Statistics More Variable Than Z Scores
Holbox
Mar 27, 2025 · 6 min read
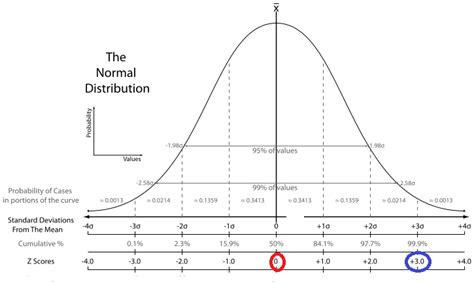
Table of Contents
- Why Are T Statistics More Variable Than Z Scores
- Table of Contents
- Why are t-statistics More Variable Than z-scores? A Deep Dive into Sampling Distributions
- The Core Difference: Population Standard Deviation vs. Sample Standard Deviation
- The Impact of Sample Variability: Why 's' Fluctuates
- The Role of Degrees of Freedom
- Visualizing the Difference: Comparing Distributions
- Mathematical Explanation: The Uncertainty in 's'
- Practical Implications: Choosing Between z and t
- The Impact of Sample Size on Variability: Convergence to Normality
- Conclusion: Understanding the Nuances of Variability
- Latest Posts
- Latest Posts
- Related Post
Why are t-statistics More Variable Than z-scores? A Deep Dive into Sampling Distributions
Understanding the difference between t-statistics and z-scores is crucial for anyone working with statistical analysis. While both measure the distance of a sample mean from a population mean in terms of standard error, they differ significantly in their variability. This article delves deep into the reasons why t-statistics are inherently more variable than z-scores, exploring the underlying assumptions, mathematical foundations, and practical implications of this difference.
The Core Difference: Population Standard Deviation vs. Sample Standard Deviation
The fundamental reason for the increased variability in t-statistics lies in the estimation of the population standard deviation. Let's break down the formulas for both:
z-score:
z = (x̄ - μ) / (σ / √n)
where:
x̄is the sample meanμis the population meanσis the population standard deviationnis the sample size
t-statistic:
t = (x̄ - μ) / (s / √n)
where:
x̄,μ, andnare the same as abovesis the sample standard deviation
The crucial difference is the use of σ (population standard deviation) in the z-score formula versus s (sample standard deviation) in the t-statistic formula. The population standard deviation (σ) is a fixed parameter; it's a characteristic of the entire population. The sample standard deviation (s), on the other hand, is a statistic – an estimate calculated from a sample drawn from the population. This estimation introduces variability.
The Impact of Sample Variability: Why 's' Fluctuates
Because the sample standard deviation (s) is calculated from a limited subset of the population, it's inherently subject to sampling error. Different samples drawn from the same population will yield different sample standard deviations. This fluctuation directly affects the calculated t-statistic. Larger samples are less prone to fluctuation, leading to a t-statistic more similar to a z-score. However, smaller samples can cause significant variation.
Imagine drawing multiple samples from a population and calculating the sample standard deviation (s) for each. These s values would likely vary, creating a distribution of sample standard deviations. This inherent variability in s translates directly into variability in the calculated t-statistic. This is in contrast to the z-score which utilizes the true and constant population standard deviation (σ).
The Role of Degrees of Freedom
The t-distribution, unlike the normal distribution (used for z-scores), incorporates the concept of degrees of freedom (df). Degrees of freedom represent the number of independent pieces of information available to estimate a parameter. In the context of the t-statistic, the degrees of freedom are typically n-1, where n is the sample size.
The smaller the sample size (and hence the smaller the degrees of freedom), the wider and flatter the t-distribution becomes. This is a direct reflection of the increased uncertainty and variability associated with using the sample standard deviation to estimate the population standard deviation. As the sample size increases (and degrees of freedom increase), the t-distribution progressively approximates the standard normal distribution, leading to decreasing variability. The impact of degrees of freedom accounts for the extra uncertainty in the sample standard deviation in smaller samples.
Visualizing the Difference: Comparing Distributions
The difference between the t-distribution and the standard normal distribution (which is the distribution of z-scores) can best be understood visually.
-
Standard Normal Distribution (z-scores): This distribution is bell-shaped, symmetric, and centered around a mean of 0 with a standard deviation of 1. It's a fixed, unchanging distribution.
-
t-distribution: This distribution is also bell-shaped and symmetric, but its shape changes depending on the degrees of freedom. With low degrees of freedom (small sample sizes), the t-distribution has heavier tails, meaning more probability mass in the extreme values. As the degrees of freedom increase (larger sample sizes), the t-distribution approaches the standard normal distribution. The heavier tails of the t-distribution with low df directly reflects the increased uncertainty and variability present due to reliance on sample standard deviation estimates.
Mathematical Explanation: The Uncertainty in 's'
The mathematical derivation of the t-distribution involves the uncertainty inherent in estimating σ with s. The t-statistic is essentially a ratio of a normally distributed variable (x̄ - μ) and an independently distributed chi-squared variable, which is related to the sample variance (and thus the sample standard deviation). The ratio of these two independently distributed random variables results in the t-distribution, which has thicker tails than the normal distribution reflecting the higher variability. The mathematical complexities involved highlight the inherent uncertainty that is absent when using the known population standard deviation in a z-score calculation.
Practical Implications: Choosing Between z and t
The choice between using a z-score or a t-statistic hinges primarily on whether the population standard deviation (σ) is known.
-
Use z-scores when: You know the population standard deviation. This is rare in most real-world scenarios.
-
Use t-statistics when: You only know the sample standard deviation. This is the far more common situation in statistical analysis. You're estimating the population parameters from sample data.
Using a z-test when you should be using a t-test can lead to inaccurate conclusions, especially with small sample sizes. The assumption that the sample standard deviation accurately reflects the population standard deviation is unreliable in small samples, impacting the reliability of the z-test.
The Impact of Sample Size on Variability: Convergence to Normality
As mentioned earlier, a larger sample size reduces the variability of the t-statistic. As the sample size (n) increases, the sample standard deviation (s) becomes a more reliable estimate of the population standard deviation (σ). Consequently, the t-distribution approaches the normal distribution, and the difference in variability between the t-statistic and the z-score diminishes. With extremely large samples, the difference becomes negligible in practice. This convergence is a direct consequence of the law of large numbers: as sample size increases, the sample statistics converge to the population parameters.
Conclusion: Understanding the Nuances of Variability
The increased variability of t-statistics compared to z-scores stems directly from the reliance on the sample standard deviation (s) as an estimate of the population standard deviation (σ). This estimation introduces uncertainty, especially in smaller samples, leading to a wider and flatter t-distribution compared to the standard normal distribution. The degrees of freedom further account for this uncertainty. Understanding this fundamental difference is critical for accurate statistical inference and choosing the appropriate statistical test for your data. While larger samples lessen the impact of this variability, always be mindful of the inherent differences between these two important statistical measures. Correct application improves the validity and reliability of your analyses.
Latest Posts
Latest Posts
-
Authorized Common Stock Refers To The Total Number Of Shares
Mar 31, 2025
-
Match The Type Of Simple Epithelium With Its Description
Mar 31, 2025
-
Multiple Sclerosis And Atherosclerosis Both Refer To
Mar 31, 2025
-
A Game Is Said To Be Fair If
Mar 31, 2025
-
Which Of The Following Is The Strongest Acid
Mar 31, 2025
Related Post
Thank you for visiting our website which covers about Why Are T Statistics More Variable Than Z Scores . We hope the information provided has been useful to you. Feel free to contact us if you have any questions or need further assistance. See you next time and don't miss to bookmark.
