Use The Pivot Table Command On The Insert Tab
Holbox
Mar 28, 2025 · 6 min read
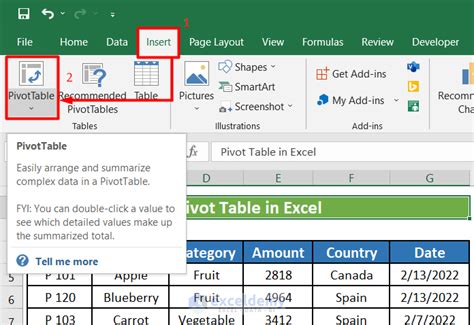
Table of Contents
- Use The Pivot Table Command On The Insert Tab
- Table of Contents
- Mastering PivotTables: A Comprehensive Guide to the Insert Tab Command
- Understanding the Power of PivotTables
- Accessing the PivotTable Command on the "Insert" Tab
- The PivotTable Wizard: Choosing Your Data Source
- Designing Your PivotTable: The PivotTable Fields Pane
- Beyond the Basics: Advanced PivotTable Features
- Troubleshooting and Best Practices
- Conclusion: Unlock the Power of Data Analysis
- Latest Posts
- Latest Posts
- Related Post
Mastering PivotTables: A Comprehensive Guide to the Insert Tab Command
PivotTables are a powerful tool in spreadsheet software like Microsoft Excel and Google Sheets, allowing you to summarize, analyze, explore, and present your data in meaningful ways. This comprehensive guide will delve into the intricacies of using the "PivotTable" command located on the "Insert" tab, equipping you with the knowledge and skills to effectively harness this data analysis powerhouse. We'll explore its functionality, various options, and best practices to maximize its efficiency.
Understanding the Power of PivotTables
Before diving into the "Insert" tab command, let's establish a firm understanding of what PivotTables can achieve. They're designed to transform raw data into insightful summaries. Imagine having a large dataset – thousands of sales transactions, customer demographics, or website analytics. Sifting through this manually to identify trends or patterns is incredibly time-consuming and prone to error. PivotTables automate this process, allowing you to:
- Summarize Data: Quickly calculate sums, averages, counts, and other aggregations of your data based on various criteria.
- Analyze Trends: Identify patterns and trends across different dimensions of your data, revealing hidden insights.
- Filter and Sort Data: Easily filter and sort your data to focus on specific subsets, isolating key information.
- Create Interactive Reports: Generate dynamic reports that allow users to interact with the data, exploring different perspectives and drill-downs.
- Generate Charts and Graphs: Visualize your data with charts and graphs directly from your PivotTable, enhancing comprehension and impact.
Accessing the PivotTable Command on the "Insert" Tab
The journey to creating a PivotTable begins with the "Insert" tab. Here's how to locate and utilize the command:
-
Open your spreadsheet: Start by opening the spreadsheet containing the data you wish to analyze. Ensure your data is organized in a clear and consistent manner, with headers for each column.
-
Navigate to the "Insert" Tab: Locate the "Insert" tab at the top of your spreadsheet window (in Excel or similar programs). This tab houses various tools for inserting elements into your spreadsheet, including PivotTables.
-
Click on "PivotTable": Within the "Insert" tab, you'll find a group of options, usually near the left. Click on the "PivotTable" button.
This action will initiate the PivotTable creation wizard, guiding you through the process of defining your data source and configuring your PivotTable.
The PivotTable Wizard: Choosing Your Data Source
The first step in the PivotTable wizard is selecting the data source. This determines the data that your PivotTable will analyze.
-
Selecting the Data Range: The wizard will present a dialog box. You have two main options:
-
Selecting a Table or Range: This is the most common method. Click and drag your mouse to highlight the entire range of data you want to include in your PivotTable, including the headers. Ensure you include all the relevant columns.
-
Selecting a Table: If your data is already organized as an Excel table, you can simply select the table name from the dropdown menu. This automatically updates the PivotTable if your table data changes.
-
-
Choosing the PivotTable Location: After selecting your data range, the wizard will ask you where you want to place your new PivotTable.
-
New Worksheet: This will create a new sheet dedicated solely to your PivotTable. This is ideal for larger, more complex PivotTables.
-
Existing Worksheet: This will place the PivotTable on the current worksheet, allowing you to integrate it directly with your data. You'll need to specify a location on the existing sheet.
-
-
Click "OK": Once you've selected your data source and location, click "OK" to proceed. This will launch the PivotTable Fields pane, where you'll design your PivotTable's layout and functionality.
Designing Your PivotTable: The PivotTable Fields Pane
The PivotTable Fields pane is the heart of PivotTable creation. It allows you to drag and drop fields (columns) from your data source into different areas of the PivotTable to configure its structure and calculations. These areas include:
-
Filters: Fields placed here act as filters, allowing you to refine the data displayed in the PivotTable. Only data matching the selected filter criteria will be shown.
-
Columns: Fields placed here will appear as column headers in your PivotTable. They usually represent the categories or groups you want to analyze horizontally.
-
Rows: Fields placed here will appear as row labels in your PivotTable. They represent the categories or groups you want to analyze vertically.
-
Values: This is where you define the calculations you want performed on your data. By default, it often sums numerical values, but you can change this to averages, counts, minimums, maximums, and many other functions.
Example: Imagine you have sales data with columns for "Region," "Product," "Salesperson," and "Sales Amount."
-
You might place "Region" in "Rows," "Product" in "Columns," and "Sales Amount" in "Values" to see the total sales amount for each product in each region.
-
You could add "Salesperson" as a filter to focus on the sales performance of a specific salesperson.
Beyond the Basics: Advanced PivotTable Features
Once you've created your basic PivotTable, the possibilities expand significantly. You can further enhance its functionality through various options:
-
Calculated Fields: Create new fields based on existing ones using formulas, allowing you to perform custom calculations directly within the PivotTable. For example, you might calculate a profit margin by subtracting costs from sales.
-
Calculated Items: Create new items within existing fields based on specific criteria. For example, you could create a calculated item representing "High-Value Customers" based on sales thresholds.
-
Grouping: Group data into ranges or categories to simplify the analysis. This is particularly useful for dates or numerical data.
-
Slicers: Add visual filters (slicers) to allow users to easily filter the PivotTable interactively by clicking on different categories.
-
Timeline: Create a timeline slicer to filter data based on a date range. This is incredibly useful for time-series analysis.
-
Formatting: Customize the appearance of your PivotTable with different fonts, colors, and styles.
Troubleshooting and Best Practices
While PivotTables are powerful, challenges can arise. Here are some common troubleshooting tips and best practices:
-
Data Integrity: Ensure your data is clean and accurate before creating a PivotTable. Inconsistent data will lead to inaccurate results.
-
Data Types: Be mindful of data types. PivotTable calculations will vary depending on whether a field is numerical, text, or date.
-
Large Datasets: For very large datasets, consider optimizing your data before creating a PivotTable. This could involve filtering or summarizing data beforehand.
-
Error Handling: Learn to identify and resolve errors within your PivotTable. Understanding error messages is crucial for debugging.
-
Regular Updates: If your underlying data changes, refresh your PivotTable to reflect the latest information.
Conclusion: Unlock the Power of Data Analysis
The "PivotTable" command on the "Insert" tab is the gateway to unlocking powerful data analysis capabilities within your spreadsheet software. By understanding its features, options, and best practices, you can transform raw data into actionable insights, driving better decision-making and enhanced understanding of your data. Mastering PivotTables is a valuable skill for anyone working with data, enabling efficiency and revealing hidden patterns that would otherwise remain obscured. So, explore the possibilities, experiment with different configurations, and unlock the full power of PivotTables in your data analysis journey.
Latest Posts
Latest Posts
-
The Purpose Of Cycle Counting Is To
Apr 01, 2025
-
Aldosterone From The Adrenal Cortex Causes Sodium Ions To Be
Apr 01, 2025
-
Why Should You Stock Brightly Colored Bandages
Apr 01, 2025
-
Database File Maintenance Typically Involves Select All That Apply
Apr 01, 2025
-
Henry Is Working At The Hospital Information Desk
Apr 01, 2025
Related Post
Thank you for visiting our website which covers about Use The Pivot Table Command On The Insert Tab . We hope the information provided has been useful to you. Feel free to contact us if you have any questions or need further assistance. See you next time and don't miss to bookmark.
