Match Each Graph With The Corresponding Function Type
Holbox
Mar 16, 2025 · 6 min read
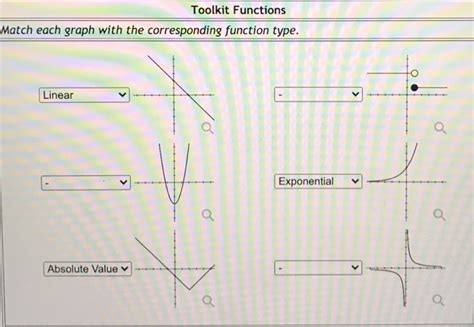
Table of Contents
Matching Graphs with Corresponding Function Types: A Comprehensive Guide
Understanding the visual representation of functions through graphs is crucial in mathematics and various scientific fields. This comprehensive guide will equip you with the knowledge to accurately match graphs with their corresponding function types. We'll delve into the characteristics of different function types, including linear, quadratic, cubic, exponential, logarithmic, rational, and trigonometric functions, and how their unique properties manifest in their graphical representations.
Identifying Key Features of Function Graphs
Before we dive into specific function types, let's establish some fundamental concepts that will help you analyze graphs effectively. These features provide crucial clues for identifying the underlying function.
1. Intercepts: Where the Graph Meets the Axes
-
x-intercepts (roots or zeros): Points where the graph crosses the x-axis (where y = 0). These represent the solutions to the equation f(x) = 0. The number of x-intercepts can provide clues about the degree of a polynomial function.
-
y-intercept: The point where the graph crosses the y-axis (where x = 0). This is the value of f(0) and is easily identifiable on the graph.
2. Asymptotes: Lines the Graph Approaches but Doesn't Cross
-
Vertical asymptotes: Vertical lines (x = a) that the graph approaches as x approaches 'a' from the left or right. These often occur when the denominator of a rational function is zero.
-
Horizontal asymptotes: Horizontal lines (y = b) that the graph approaches as x approaches positive or negative infinity. These indicate the limiting behavior of the function as x gets very large or very small.
-
Oblique (slant) asymptotes: Diagonal lines that the graph approaches as x approaches positive or negative infinity. These occur in some rational functions where the degree of the numerator is one greater than the degree of the denominator.
3. Turning Points (Extrema): Peaks and Valleys
-
Local maximum: A point where the function value is greater than the values at nearby points. It's a "peak" in the graph.
-
Local minimum: A point where the function value is less than the values at nearby points. It's a "valley" in the graph.
-
Global maximum/minimum: The highest/lowest point on the entire graph, if it exists.
4. Symmetry: Reflections and Patterns
-
Even functions: Symmetric about the y-axis (f(-x) = f(x)). The graph looks identical on both sides of the y-axis.
-
Odd functions: Symmetric about the origin (f(-x) = -f(x)). The graph can be rotated 180 degrees about the origin and remain unchanged.
Matching Graphs to Function Types: A Detailed Analysis
Now let's explore the visual characteristics of different function types and how to identify them from their graphs.
1. Linear Functions (f(x) = mx + c)
- Graph: A straight line.
- Characteristics: Constant slope (m), y-intercept (c). No turning points, asymptotes, or symmetry (unless m=0).
- Example: A graph showing a straight line with a positive slope indicates a linear function with a positive 'm' value.
2. Quadratic Functions (f(x) = ax² + bx + c)
- Graph: A parabola (U-shaped curve).
- Characteristics: One turning point (either a minimum or maximum), axis of symmetry (a vertical line passing through the vertex). The number of x-intercepts can be 0, 1, or 2.
- Example: A U-shaped curve opening upwards indicates a positive 'a' value, while a curve opening downwards indicates a negative 'a' value.
3. Cubic Functions (f(x) = ax³ + bx² + cx + d)
- Graph: A curve with at most two turning points.
- Characteristics: Can have one, two, or three x-intercepts. No horizontal asymptotes. The general shape resembles an "S".
- Example: A graph resembling an "S" shape with one or two turning points indicates a cubic function.
4. Exponential Functions (f(x) = a<sup>x</sup>, where a > 0 and a ≠ 1)
- Graph: A curve that increases or decreases rapidly.
- Characteristics: No x-intercepts (unless shifted vertically). Has a horizontal asymptote at y = 0 if not vertically shifted. The curve approaches the asymptote but never touches it. If a > 1, the function increases; if 0 < a < 1, the function decreases.
- Example: A graph showing rapid growth or decay, approaching a horizontal asymptote, suggests an exponential function.
5. Logarithmic Functions (f(x) = log<sub>a</sub>x, where a > 0 and a ≠ 1)
- Graph: A curve that increases or decreases slowly.
- Characteristics: No y-intercept. Has a vertical asymptote at x = 0. The function is the inverse of the exponential function. If a > 1, the function increases; if 0 < a < 1, the function decreases.
- Example: A graph showing slow growth or decay, approaching a vertical asymptote, suggests a logarithmic function.
6. Rational Functions (f(x) = p(x)/q(x), where p(x) and q(x) are polynomials)
- Graph: Can have a variety of shapes, often with asymptotes.
- Characteristics: May have vertical asymptotes where q(x) = 0. May have horizontal or oblique asymptotes depending on the degrees of p(x) and q(x). Can have x-intercepts where p(x) = 0.
- Example: A graph with vertical asymptotes and possibly horizontal or oblique asymptotes indicates a rational function.
7. Trigonometric Functions (f(x) = sin x, cos x, tan x, etc.)
- Graph: Periodic functions with repeating patterns.
- Characteristics: Sine and cosine have a range of [-1, 1] and oscillate between these values. Tangent has vertical asymptotes. The period (length of one cycle) is a key characteristic.
- Example: A graph showing a repeating wave pattern indicates a trigonometric function.
Practice Problems: Test Your Skills
Let's solidify your understanding with some practice problems. Imagine you are given several graphs without any equations. Can you determine which function type each graph corresponds to based on its characteristics? Consider the intercepts, asymptotes, turning points, and symmetry.
Graph A: A straight line passing through points (0, 2) and (1, 5).
Graph B: A parabola opening downwards with a vertex at (1, 4).
Graph C: An "S" shaped curve with two turning points, crossing the x-axis at three points.
Graph D: A curve increasing rapidly, approaching a horizontal asymptote at y = 0.
Graph E: A curve increasing slowly, approaching a vertical asymptote at x = 0.
Graph F: A graph with two vertical asymptotes and a horizontal asymptote.
Graph G: A repeating wave pattern oscillating between -1 and 1.
Solutions:
- Graph A: Linear Function
- Graph B: Quadratic Function
- Graph C: Cubic Function
- Graph D: Exponential Function
- Graph E: Logarithmic Function
- Graph F: Rational Function
- Graph G: Trigonometric Function (Sine or Cosine)
Advanced Considerations and Further Exploration
This guide provides a foundational understanding of matching graphs to function types. As you progress in your mathematical studies, you'll encounter more complex functions and variations, including piecewise functions, parametric equations, and polar coordinates. Each requires a deeper understanding of the underlying principles and may involve additional techniques for analysis.
Remember, practice is key! The more graphs you analyze, the better you'll become at identifying their corresponding function types. Use online resources, textbooks, and practice problems to enhance your skills. Mastering this skill will significantly improve your comprehension of mathematical concepts and their applications in various fields.
Latest Posts
Latest Posts
-
Select The Vibrations That Should Be Infrared Active
Mar 16, 2025
-
How Many Centimeters Is A Nickel
Mar 16, 2025
-
Label The Components Of A Synapse
Mar 16, 2025
-
Consider The Following Two Mutually Exclusive Projects
Mar 16, 2025
-
Transfer Prices Check All That Apply
Mar 16, 2025
Related Post
Thank you for visiting our website which covers about Match Each Graph With The Corresponding Function Type . We hope the information provided has been useful to you. Feel free to contact us if you have any questions or need further assistance. See you next time and don't miss to bookmark.
