Label The Energy Diagram For A Two Step Reaction
Holbox
Mar 25, 2025 · 6 min read
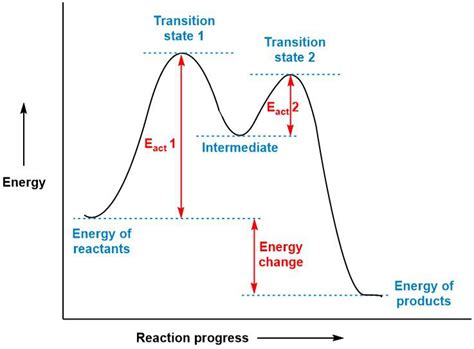
Table of Contents
- Label The Energy Diagram For A Two Step Reaction
- Table of Contents
- Labeling Energy Diagrams for Two-Step Reactions: A Comprehensive Guide
- Understanding the Basics of Energy Diagrams
- Deconstructing Two-Step Reactions
- Key Features of a Two-Step Reaction Energy Diagram:
- Labeling the Energy Diagram: A Step-by-Step Guide
- Interpreting the Energy Diagram: Rate-Determining Step
- Advanced Considerations and Nuances
- Conclusion
- Latest Posts
- Latest Posts
- Related Post
Labeling Energy Diagrams for Two-Step Reactions: A Comprehensive Guide
Understanding reaction mechanisms is crucial in chemistry. Visualizing these mechanisms through energy diagrams provides a powerful tool for comprehending the energetics and the progression of a reaction. This article delves into the intricacies of labeling energy diagrams for two-step reactions, offering a clear, comprehensive guide for students and enthusiasts alike. We will explore the key components, their significance, and the nuances of representing various aspects of a multi-step reaction pathway.
Understanding the Basics of Energy Diagrams
Before diving into the complexities of two-step reactions, let's establish a foundational understanding of energy diagrams. These diagrams, also known as reaction coordinate diagrams or energy profile diagrams, graphically represent the energy changes that occur during a chemical reaction. The x-axis typically represents the reaction coordinate, which is a measure of the progress of the reaction from reactants to products. It's not a directly measurable quantity but rather a conceptual representation of the changes in bond lengths, bond angles, and other structural features throughout the reaction. The y-axis represents the potential energy of the system.
A simple, one-step reaction would show a single peak representing the transition state, the highest-energy point along the reaction coordinate. The difference in energy between the reactants and the products is the ΔH (change in enthalpy) of the reaction. If the products have lower energy than the reactants, the reaction is exothermic (ΔH < 0); if the products have higher energy, the reaction is endothermic (ΔH > 0).
Deconstructing Two-Step Reactions
Two-step reactions, as the name suggests, involve two distinct steps, each with its own transition state. This leads to a more complex energy diagram with two peaks representing the two transition states and an intermediate, a relatively stable species formed during the reaction between the reactants and the final products.
Key Features of a Two-Step Reaction Energy Diagram:
- Reactants (R): This is the starting point of the reaction, represented on the far left of the diagram at a specific energy level.
- Intermediate (I): Formed after the first step, this species is relatively stable compared to the transition states but less stable than either the reactants or products. It resides in an energy well between the two activation energy peaks.
- Products (P): The final species of the reaction, located on the far right of the diagram, at its respective energy level.
- Transition States (TS1, TS2): These are high-energy, short-lived species representing the highest energy point along the reaction coordinate for each step. They are not true intermediates and cannot be isolated.
- Activation Energies (Ea1, Ea2): The energy difference between the reactants (or intermediate for the second step) and the corresponding transition state. Ea1 is the activation energy for the first step, and Ea2 is the activation energy for the second step.
- ΔH1 and ΔH2: The enthalpy change for each individual step.
- Overall ΔH: The overall enthalpy change for the entire two-step reaction, calculated by the difference between the energy level of reactants and products.
Labeling the Energy Diagram: A Step-by-Step Guide
Let's illustrate with a hypothetical two-step reaction:
A + B → C → D
Here, A and B are the reactants, C is the intermediate, and D is the product.
-
Draw the Axes: Draw the x-axis (reaction coordinate) and the y-axis (potential energy).
-
Plot the Reactants and Products: Mark the energy levels of the reactants (A + B) on the far left and the products (D) on the far right. The relative energies of these points determine whether the overall reaction is exothermic or endothermic.
-
Plot the Intermediate: Draw an energy well representing the intermediate (C) between the reactants and products. The depth of this well indicates the relative stability of the intermediate.
-
Plot the Transition States: Draw peaks representing the transition states (TS1 and TS2) corresponding to the highest energy points of each step. TS1 is positioned between the reactants and the intermediate, while TS2 is positioned between the intermediate and the products.
-
Label the Activation Energies: Label the energy difference between the reactants and TS1 as Ea1 and the energy difference between the intermediate and TS2 as Ea2.
-
Label the Enthalpy Changes: Label the energy difference between the reactants and the intermediate as ΔH1, and label the energy difference between the intermediate and the products as ΔH2. Calculate and label the overall enthalpy change (ΔH) by subtracting the energy level of the reactants from the energy level of the products. This shows the overall exothermic or endothermic nature of the reaction.
-
Label all components: Clearly label the reactants (A + B), intermediate (C), products (D), transition states (TS1, TS2), activation energies (Ea1, Ea2), and enthalpy changes (ΔH1, ΔH2, ΔH).
-
Add a title: Give your diagram a descriptive title, such as "Energy Diagram for a Two-Step Reaction: A + B → C → D".
Interpreting the Energy Diagram: Rate-Determining Step
The energy diagram provides insights into the reaction mechanism, especially in identifying the rate-determining step. This is the slowest step in the reaction sequence, which dictates the overall rate of the reaction. In a two-step reaction, the step with the higher activation energy (larger Ea) is the rate-determining step. In our example:
- If Ea1 > Ea2, the first step (A + B → C) is rate-determining.
- If Ea2 > Ea1, the second step (C → D) is rate-determining.
Advanced Considerations and Nuances
While the basic framework described above suffices for many scenarios, certain complexities warrant attention:
- Catalyst effects: Catalysts lower the activation energy, impacting both steps and potentially altering the rate-determining step. This would be represented by lowering the peaks of the transition states on the energy diagram.
- Multi-step reactions beyond two steps: The principles extend to reactions with more than two steps, resulting in multiple peaks and wells on the diagram.
- Concerted reactions: Some reactions proceed through a single transition state despite multiple bond-making and bond-breaking events. These reactions are called concerted reactions and are not strictly two-step reactions. Their energy diagrams only show one activation energy barrier.
- Reverse reactions: The diagram can also be used to illustrate the energetics of the reverse reaction. The activation energy for the reverse reaction is represented by the energy difference between the products and the corresponding transition state.
- Different reaction pathways: For some reactions, multiple reaction pathways may exist. This can be shown by adding additional curves to the energy diagram representing different mechanistic routes.
Conclusion
Creating and interpreting energy diagrams for two-step reactions is a fundamental skill in chemistry. By carefully labeling each component – reactants, intermediates, products, transition states, activation energies, and enthalpy changes – one gains a powerful visual representation of the reaction's energetics and mechanism. Understanding the rate-determining step and the influence of factors like catalysts provides a deeper comprehension of reaction kinetics and dynamics. Mastering this skill allows for effective analysis and prediction of reaction behavior. Remember to always clearly label all aspects of the diagram for accurate interpretation and effective communication of chemical concepts.
Latest Posts
Latest Posts
-
In Which Of The Following Situations Is Passing Always Forbidden
Mar 26, 2025
-
Economists Often Track Employment Trends By Measuring The Proportion
Mar 26, 2025
-
8 2 7 Sum Rows In A 2d Array
Mar 26, 2025
-
Which Nims Component Includes The Ics
Mar 26, 2025
-
Data Related To The Inventories Of Mountain Ski Equipment
Mar 26, 2025
Related Post
Thank you for visiting our website which covers about Label The Energy Diagram For A Two Step Reaction . We hope the information provided has been useful to you. Feel free to contact us if you have any questions or need further assistance. See you next time and don't miss to bookmark.
