How To Calculate The Expected Frequency
Holbox
Mar 10, 2025 · 6 min read
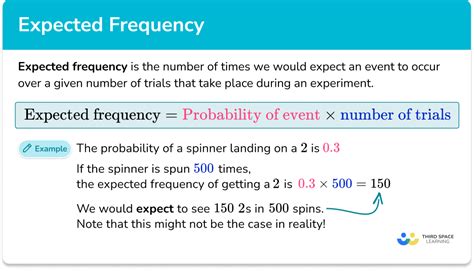
Table of Contents
How to Calculate Expected Frequency: A Comprehensive Guide
Expected frequency, a cornerstone of statistical analysis, represents the anticipated number of times an event is likely to occur given specific conditions. Understanding how to calculate expected frequency is crucial for various statistical tests, including the chi-squared test, which assesses the difference between observed and expected frequencies to determine statistical significance. This comprehensive guide will delve into the intricacies of calculating expected frequencies, exploring different scenarios and providing practical examples.
Understanding the Fundamentals
Before diving into the calculations, let's solidify our understanding of the core concepts:
-
Observed Frequency (O): This refers to the actual number of times an event occurred in a real-world experiment or observation. It's the data you collect.
-
Expected Frequency (E): This is the theoretical frequency of an event based on a specific hypothesis or probability model. It's what you expect to observe if your hypothesis is true.
-
Hypothesis: A statement or assumption about the population you're studying. This hypothesis often underpins the calculation of expected frequencies.
The discrepancy between observed and expected frequencies is key to many statistical tests. A large difference might suggest that your hypothesis is incorrect or that other factors are at play.
Calculating Expected Frequency: Different Scenarios
The method for calculating expected frequency varies depending on the context of your analysis. Let's explore several common scenarios:
1. Simple Probability and Expected Frequency
In scenarios involving simple probability, the expected frequency is calculated by multiplying the total number of trials (or observations) by the probability of the event occurring.
Formula: E = n * p
Where:
E= Expected frequencyn= Total number of trials or observationsp= Probability of the event occurring
Example: Suppose you flip a fair coin 100 times. What's the expected frequency of getting heads?
n= 100 (total flips)p= 0.5 (probability of getting heads)E= 100 * 0.5 = 50
Therefore, you'd expect to get heads 50 times.
2. Contingency Tables and Expected Frequencies
Contingency tables, also known as cross-tabulations, are used to analyze the relationship between two or more categorical variables. Calculating expected frequencies in contingency tables is slightly more involved.
Formula for each cell in a contingency table:
E = (Row Total * Column Total) / Grand Total
Where:
E= Expected frequency for a specific cell- Row Total = Sum of observed frequencies in that row
- Column Total = Sum of observed frequencies in that column
- Grand Total = Total number of observations in the entire table
Example: Let's consider a study investigating the relationship between smoking and lung cancer.
| Lung Cancer | No Lung Cancer | Row Total | |
|---|---|---|---|
| Smokers | 50 | 50 | 100 |
| Non-Smokers | 10 | 140 | 150 |
| Column Total | 60 | 190 | 250 |
Let's calculate the expected frequency for smokers with lung cancer:
- Row Total (Smokers) = 100
- Column Total (Lung Cancer) = 60
- Grand Total = 250
- E = (100 * 60) / 250 = 24
The expected frequency of smokers with lung cancer is 24. We would perform similar calculations for each cell in the table.
3. Expected Frequency in Poisson Distribution
The Poisson distribution models the probability of a given number of events occurring in a fixed interval of time or space if these events occur with a known average rate and independently of the time since the last event. The expected frequency in a Poisson distribution is simply the mean (λ).
Formula: E = λ
Where:
E= Expected frequency- λ = Mean (average rate of events)
Example: If the average number of cars passing a certain point on a highway per hour is 10 (λ = 10), then the expected frequency of cars passing that point in an hour is 10.
4. Expected Frequency in Binomial Distribution
The binomial distribution models the probability of a certain number of successes in a fixed number of independent Bernoulli trials (trials with only two possible outcomes, success or failure). The expected frequency for a specific number of successes (k) in a binomial distribution is calculated as follows:
Formula: E = n * p^k * (1-p)^(n-k) * (n! / (k! * (n-k)!))
Where:
E= Expected frequency of k successesn= Number of trialsp= Probability of success in a single trial- k = Number of successes
- ! denotes the factorial function (e.g., 5! = 54321)
This formula can be computationally intensive for larger values of n and k, making statistical software helpful for these calculations.
Interpreting Expected Frequencies
The calculated expected frequencies are not predictions of exact outcomes. Instead, they represent the most likely frequencies if your underlying hypothesis is true. The difference between observed and expected frequencies is crucial for statistical testing. Large discrepancies often indicate that your hypothesis needs revision or that other factors influence the results.
Using Expected Frequencies in Hypothesis Testing
Expected frequencies are vital in various statistical hypothesis tests, most notably the chi-squared test. This test measures the discrepancy between observed and expected frequencies to assess whether there's a statistically significant difference. A significant difference suggests that the observed data is unlikely to have arisen purely by chance if the null hypothesis (the hypothesis being tested) were true.
Software for Calculating Expected Frequencies
While manual calculations are valuable for understanding the underlying principles, statistical software packages significantly simplify the process, especially for complex scenarios like large contingency tables or those involving complex probability distributions. Software such as R, SPSS, SAS, and Python (with libraries like SciPy and Statsmodels) offer functions to easily calculate expected frequencies and perform related statistical tests.
Addressing Potential Challenges and Limitations
While calculating expected frequencies is a powerful tool, it's essential to be aware of potential challenges and limitations:
-
Sample Size: Small sample sizes can lead to unreliable expected frequencies, making statistical inferences less robust.
-
Independence of Observations: The accuracy of expected frequencies hinges on the independence of observations. If observations are correlated, the calculated frequencies may be misleading.
-
Accuracy of Probabilities: If the probabilities used to calculate expected frequencies are inaccurate or based on weak assumptions, the results will also be unreliable.
-
Assumptions of the Statistical Test: Different statistical tests make different assumptions about the data. Violation of these assumptions can invalidate the interpretation of expected frequencies.
Conclusion: Mastering the Art of Expected Frequency Calculation
Calculating expected frequencies is a fundamental skill in statistics. Understanding how to calculate and interpret expected frequencies across different scenarios empowers you to perform a range of statistical tests, make informed conclusions about data, and critically evaluate research findings. Remember that the accuracy and reliability of your results depend on the validity of your underlying assumptions and the appropriate application of statistical methods. Utilizing statistical software can streamline complex calculations and allow for more efficient analysis of your data. Continual practice and a thorough grasp of the underlying statistical principles are key to mastering this important statistical concept.
Latest Posts
Latest Posts
-
Cyclemoney Co Latest Posts Categories Finance Money
Mar 10, 2025
-
The Average Variable Cost Per Sale At H
Mar 10, 2025
-
Low Is Too High As Easy Is To
Mar 10, 2025
-
If Is A Linear Transformation Such That And Then
Mar 10, 2025
-
Molar Latent Heat Of The Transformation Caf2
Mar 10, 2025
Related Post
Thank you for visiting our website which covers about How To Calculate The Expected Frequency . We hope the information provided has been useful to you. Feel free to contact us if you have any questions or need further assistance. See you next time and don't miss to bookmark.
