Draw The Shear Diagram For The Cantilevered Beam
Holbox
Mar 15, 2025 · 6 min read
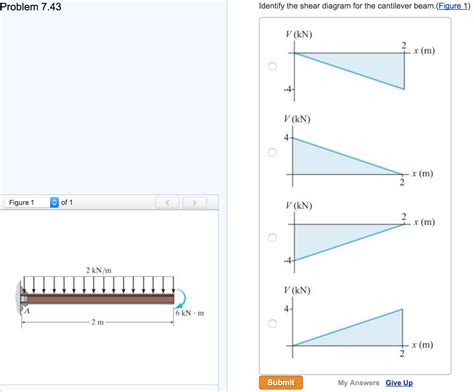
Table of Contents
Drawing the Shear Diagram for a Cantilevered Beam: A Comprehensive Guide
Understanding shear diagrams is crucial for structural engineers and anyone working with the mechanics of materials. This comprehensive guide will walk you through the process of drawing a shear diagram for a cantilevered beam, a common structural element. We'll cover various load scenarios, from simple point loads to uniformly distributed loads, and provide step-by-step instructions to help you master this essential skill.
What is a Cantilevered Beam?
A cantilevered beam is a structural member that is fixed at one end and free at the other. This fixed end provides support, resisting both vertical and horizontal forces, as well as moments. The free end is unsupported and is where the beam experiences maximum deflection. Cantilever beams are frequently found in structures like balconies, diving boards, and aircraft wings.
Understanding Shear Force
Shear force is the internal force within a beam that acts parallel to the cross-section. It's a result of the external loads applied to the beam. Imagine cutting the beam at a certain point; the shear force is the force needed to maintain equilibrium on either side of the cut. A positive shear force indicates that the upper part of the beam tends to slide to the right relative to the lower part, while a negative shear force indicates the opposite.
Steps to Draw a Shear Diagram
Drawing a shear diagram involves a systematic approach. Here's a step-by-step process:
-
Draw the Free Body Diagram (FBD): This is the foundation of your analysis. Clearly illustrate the beam, its supports, and all applied loads (point loads, uniformly distributed loads (UDLs), uniformly varying loads (UVLs), etc.). Indicate the direction and magnitude of each load. Label all relevant distances. This crucial step ensures accuracy in subsequent calculations.
-
Determine Reactions at the Support: For a cantilevered beam, the fixed support reacts with a vertical reaction force (R<sub>y</sub>) and a moment (M). Using the principles of statics (ΣF<sub>y</sub> = 0 and ΣM = 0), calculate these reaction forces. Remember, ΣF<sub>y</sub> = 0 means the sum of vertical forces is zero, and ΣM = 0 means the sum of moments about any point is zero.
-
Start at the Free End: Begin at the free end of the beam (the unsupported end). The shear force at the free end is zero.
-
Move Along the Beam: As you move along the beam from the free end towards the fixed end, account for each load encountered.
-
Point Load: A point load causes an abrupt change in the shear force. If the load acts downwards, the shear force decreases by the magnitude of the load. If the load acts upwards, the shear force increases by the magnitude of the load. The shear diagram will show a vertical jump at the point of application.
-
Uniformly Distributed Load (UDL): A UDL causes a linear change in the shear force. The shear force changes at a constant rate equal to the magnitude of the UDL. The shear diagram will show a slanted line with a slope equal to the UDL.
-
Uniformly Varying Load (UVL): A UVL causes a parabolic change in the shear force. The rate of change of the shear force is not constant, resulting in a curved line on the shear diagram. The calculation for the shear force under a UVL involves integration.
-
-
Reach the Fixed Support: At the fixed support, the shear force will be equal to the vertical reaction force (R<sub>y</sub>) calculated in step 2. This ensures equilibrium.
Examples: Drawing Shear Diagrams for Different Load Cases
Let's illustrate the process with different load scenarios on a cantilevered beam of length L:
Example 1: Single Point Load at the Free End
Imagine a cantilevered beam with a point load P acting downwards at the free end.
-
FBD: The FBD shows the beam, the fixed support at the left end, and the downward point load P at the right end.
-
Reactions: R<sub>y</sub> = P (upwards) and M = PL (clockwise).
-
Shear Diagram: Starting at the free end (shear = 0), the shear force jumps down by P as we reach the load. It remains constant at -P until the fixed support where it ends at -P (equal to the vertical reaction). The diagram is a horizontal line at -P.
Example 2: Uniformly Distributed Load (UDL)
Consider a cantilevered beam with a uniformly distributed load (w) acting over its entire length L.
-
FBD: The FBD shows the beam, the fixed support, and the UDL acting downwards along the entire length.
-
Reactions: R<sub>y</sub> = wL (upwards) and M = wL²/2 (clockwise).
-
Shear Diagram: Starting at the free end (shear = 0), the shear force decreases linearly from 0 to -wL as you move towards the fixed support. The slope of the line is -w. At the fixed support, the shear is -wL, matching the vertical reaction.
Example 3: Combination of Point Load and UDL
Let's analyze a cantilevered beam with a point load (P) at the free end and a UDL (w) along the entire length.
-
FBD: The FBD shows the beam, the fixed support, the point load P at the free end, and the UDL (w) along the beam.
-
Reactions: R<sub>y</sub> = P + wL (upwards) and M = PL + wL²/2 (clockwise).
-
Shear Diagram: Begin at the free end with a shear force of 0. At the point load, the shear force jumps down by P to -P. Then, the shear force decreases linearly due to the UDL, with a slope of -w. The final shear force at the fixed support will be -P - wL, matching the vertical reaction.
Example 4: Uniformly Varying Load (UVL)
Consider a cantilevered beam with a uniformly varying load (triangular load) starting from zero at the free end and reaching a maximum value of w at the fixed end.
-
FBD: The FBD shows the beam, the fixed support, and the triangular load.
-
Reactions: R<sub>y</sub> = wL/2 (upwards) and M = wL²/6 (clockwise). These reactions require integration of the load distribution.
-
Shear Diagram: The shear diagram starts at zero at the free end. The shear force changes parabolically due to the UVL. The shear force at the fixed support will be -wL/2, matching the reaction. The calculation involves integrating the load distribution function to find the shear force at any point along the beam.
Significance of Shear Diagrams
Shear diagrams are vital for several reasons:
-
Design of Beams: They are essential for determining the maximum shear stress within a beam, which is crucial for selecting appropriate beam sizes and materials to prevent failure.
-
Structural Analysis: They help in understanding the internal forces and the behavior of the beam under various loading conditions.
-
Deflection Calculation: Shear diagrams are a key component in calculating the deflection of the beam.
-
Identifying Critical Points: They pinpoint locations of maximum shear stress, allowing engineers to focus their attention on the most critical areas of the structure.
Conclusion
Drawing shear diagrams is a fundamental skill for structural engineers and anyone working with beam analysis. By following the steps outlined in this guide and practicing with various load scenarios, you can confidently determine the internal shear forces within a cantilevered beam and ensure its safe and effective design. Remember to always start with a clear and accurate free body diagram and meticulously account for all loads and reactions. Mastering shear diagrams is essential for successful structural analysis and design.
Latest Posts
Latest Posts
-
Match Each Description To The Corresponding Management Skill
Mar 15, 2025
-
Record The Entry To Close The Expense Accounts
Mar 15, 2025
-
Resource Restrictions Is An Access Control Mechanism
Mar 15, 2025
-
1a The Japanese Businessperson Appears To Pref
Mar 15, 2025
-
Evaluate The Definite Integral D 0 Tan D 3 Dd
Mar 15, 2025
Related Post
Thank you for visiting our website which covers about Draw The Shear Diagram For The Cantilevered Beam . We hope the information provided has been useful to you. Feel free to contact us if you have any questions or need further assistance. See you next time and don't miss to bookmark.
