Draw The Shear And Moment Diagrams For The Beam
Holbox
Mar 10, 2025 · 6 min read
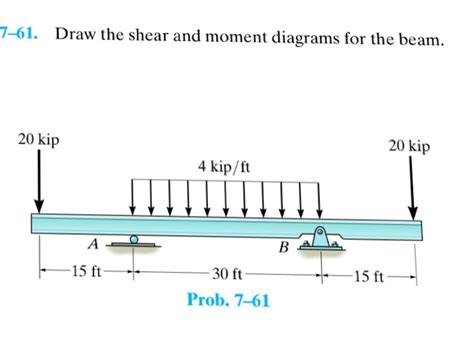
Table of Contents
Draw the Shear and Moment Diagrams for the Beam: A Comprehensive Guide
Drawing shear and moment diagrams is a fundamental skill for any structural engineer or aspiring civil engineer. These diagrams visually represent the internal forces acting within a beam under various loading conditions, providing crucial information for design and analysis. Understanding how to accurately construct these diagrams is essential for ensuring the structural integrity and safety of any beam-based structure. This comprehensive guide will walk you through the process step-by-step, covering different loading scenarios and techniques.
Understanding Shear and Moment
Before diving into the diagrams, let's clarify the concepts of shear force and bending moment:
Shear Force (V)
Shear force is the internal force acting parallel to the cross-section of the beam. It represents the tendency of one section of the beam to slide past another. Positive shear force is typically defined as the upward force on the left side of a section, or downward force on the right side. Conversely, negative shear force indicates the opposite.
Bending Moment (M)
Bending moment is the internal force that produces bending or curvature in the beam. It represents the tendency of the beam to rotate about a particular point. Positive bending moment usually causes sagging (concave upwards), while negative bending moment causes hogging (concave downwards). The sign convention can vary slightly depending on the source but consistency is key.
Steps to Draw Shear and Moment Diagrams
The process of constructing shear and moment diagrams involves a systematic approach:
-
Determine the Reactions: This is the crucial first step. Using equilibrium equations (ΣFx = 0, ΣFy = 0, ΣM = 0), calculate the support reactions at each end or support point of the beam. These reactions are essential for determining the shear and moment values along the beam.
-
Draw the Shear Force Diagram (SFD): Start by drawing a horizontal axis representing the length of the beam. Then, proceed along the beam, considering the effect of each load and reaction.
-
Concentrated Loads: A concentrated load causes an abrupt change in the shear force. The magnitude of the change is equal to the value of the concentrated load. A downward concentrated load will cause a decrease in the shear force, while an upward load (reaction) will cause an increase.
-
Uniformly Distributed Loads (UDLs): A UDL causes a linear change in shear force. The slope of the shear force diagram is equal to the magnitude of the UDL.
-
Uniformly Varying Loads (UVLs): UVLs cause a parabolic change in shear force. The diagram's shape will depend on the specific loading pattern.
-
-
Draw the Bending Moment Diagram (BMD): Once the SFD is complete, you can construct the BMD. The relationship between the SFD and BMD is crucial:
-
The area under the SFD is equal to the change in bending moment. This means that the slope of the BMD at any point is equal to the value of the shear force at that point.
-
The BMD is a graphical integration of the SFD. If the SFD is constant, the BMD will be linear. If the SFD is linear, the BMD will be parabolic, and so on.
-
Points where the shear force is zero represent points of maximum or minimum bending moment.
-
-
Label Key Points: Clearly label all significant points on the diagrams, including the maximum and minimum shear forces and bending moments, the locations of zero shear, and the values at supports.
Example: Simply Supported Beam with Point Load
Let's illustrate the process with a common example: a simply supported beam of length L subjected to a point load P at a distance 'a' from the left support.
-
Reactions: Using equilibrium equations, we find the reactions R1 and R2 at the supports:
- ΣFy = 0 => R1 + R2 = P
- ΣM (about left support) = 0 => R2 * L = P * a => R2 = Pa/L
- R1 = P - Pa/L = P(L-a)/L
-
SFD:
- At the left support (x=0): V = R1 = P(L-a)/L
- At x = a: V = R1 - P = P(L-a)/L - P = -Pa/L
- At the right support (x=L): V = R1 - P + R2 = 0
The SFD will be a straight line with a sudden drop at x = a, changing from positive to negative.
-
BMD:
- The area under the SFD from x = 0 to x = a gives the bending moment at x = a: M(a) = R1 * a = P(L-a)a/L
- The area under the SFD from x = a to x = L gives the change in bending moment from x = a to x = L. The moment at x = L is zero.
The BMD will be a triangle, reaching its maximum absolute value at x = a.
Example: Simply Supported Beam with Uniformly Distributed Load (UDL)
Consider a simply supported beam of length L subjected to a UDL of intensity w (force per unit length).
-
Reactions: Due to symmetry: R1 = R2 = wL/2
-
SFD: The shear force varies linearly along the beam.
- At the left support (x=0): V = wL/2
- At the mid-span (x=L/2): V = 0
- At the right support (x=L): V = -wL/2
-
BMD: The bending moment varies parabolically along the beam.
- At the left support (x=0): M = 0
- At the mid-span (x=L/2): M = wL²/8 (maximum bending moment)
- At the right support (x=L): M = 0
Advanced Considerations
-
Overhanging Beams: These beams extend beyond their supports, leading to more complex shear and moment diagrams. The principles remain the same, but you need to carefully account for the additional forces and moments acting on the overhanging portions.
-
Continuous Beams: These beams are supported at more than two points, requiring the use of more advanced techniques, such as the moment distribution method or the stiffness matrix method, to determine the support reactions.
-
Cantilever Beams: A cantilever beam is fixed at one end and free at the other. The fixed end provides both a vertical reaction and a moment reaction, significantly impacting the shear and moment diagrams.
-
Combined Loadings: Real-world beams often experience multiple loads (point loads, UDLs, UVLs) simultaneously. You'll need to superpose the effects of each load to obtain the complete shear and moment diagrams. This involves adding the individual shear forces and bending moments at each point along the beam.
-
Influence Lines: Influence lines are diagrams that show how the shear force or bending moment at a specific point on the beam changes as a unit load moves across the beam. They are useful for determining the maximum shear and moment values under live loads.
Software Tools
While manual calculations are essential for understanding the underlying principles, software tools can significantly speed up the process of drawing shear and moment diagrams. Many structural analysis software packages can automatically generate these diagrams once the beam geometry and loading conditions are defined.
Conclusion
Drawing accurate shear and moment diagrams is paramount in structural engineering. This guide provides a comprehensive framework for understanding and applying the necessary steps. Remember, practice is key. Working through various examples, starting with simple beams and progressing to more complex scenarios, will solidify your understanding and develop your skills in this fundamental area of structural analysis. Mastering this skill will significantly improve your ability to design and analyze safe and efficient structures. By thoroughly understanding the relationship between loading, shear, and moment, you can effectively assess the strength and stability of any beam.
Latest Posts
Latest Posts
-
Which Is Not A Limitation Of Using Closed Source Llms
Mar 10, 2025
-
Employees Working For A Licensed Establishment
Mar 10, 2025
-
Predict The Major Product Of The Following Reactions
Mar 10, 2025
-
Ap Classroom Unit 8 Progress Check Mcq Answers
Mar 10, 2025
-
Calculate The Node Voltages In The Circuit Shown Below
Mar 10, 2025
Related Post
Thank you for visiting our website which covers about Draw The Shear And Moment Diagrams For The Beam . We hope the information provided has been useful to you. Feel free to contact us if you have any questions or need further assistance. See you next time and don't miss to bookmark.
