At Equilibrium Producer Surplus Is Represented By The Area
Holbox
Mar 27, 2025 · 6 min read
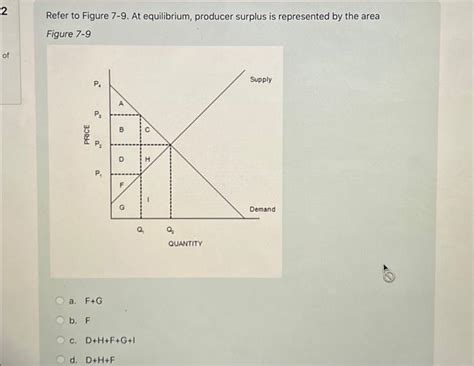
Table of Contents
- At Equilibrium Producer Surplus Is Represented By The Area
- Table of Contents
- At Equilibrium, Producer Surplus is Represented by the Area Below the Price Line and Above the Supply Curve
- Understanding Producer Surplus
- Graphical Representation of Producer Surplus at Equilibrium
- Calculating Producer Surplus
- Changes in Equilibrium and Producer Surplus
- Importance of Producer Surplus in Economic Analysis
- Producer Surplus and Related Concepts
- Conclusion
- Latest Posts
- Latest Posts
- Related Post
At Equilibrium, Producer Surplus is Represented by the Area Below the Price Line and Above the Supply Curve
Producer surplus is a crucial concept in microeconomics, representing the difference between the price a producer receives for a good and the minimum price they would be willing to accept. Understanding producer surplus is vital for analyzing market efficiency, government intervention, and the overall welfare of producers within an economy. At equilibrium, where supply and demand intersect, the producer surplus takes on a specific graphical representation, which we will explore in detail.
Understanding Producer Surplus
Before diving into the graphical representation at equilibrium, let's solidify the fundamental understanding of producer surplus. It's the aggregate benefit producers receive from selling goods or services in the market. This benefit stems from the fact that producers are typically willing to sell their goods at various prices, reflecting their different costs of production. Some producers may have lower costs and are willing to sell even at lower prices, while others require higher prices to cover their costs and make a profit.
The supply curve visually represents the minimum price producers are willing to accept for each unit of a good. This curve slopes upward because, generally, higher quantities supplied require higher prices to incentivize producers to increase their output. The willingness to sell at a specific price is often influenced by factors such as production costs, technology, and input prices.
Producer surplus for an individual producer is the difference between the market price and the producer's individual cost of production for a specific unit. When the market price is above the producer's cost, they earn a surplus, representing their profit from that transaction. Aggregate producer surplus, which is the focus of this article, is the sum of all individual producer surpluses in the market.
Graphical Representation of Producer Surplus at Equilibrium
At the market equilibrium, the supply and demand curves intersect, determining the equilibrium price and quantity. This point represents the market-clearing price – the price at which the quantity demanded equals the quantity supplied. This equilibrium is fundamental to understanding the area representing producer surplus.
The graphical representation of producer surplus at equilibrium is a crucial element to grasp:
-
The Equilibrium Price: This is the price at which the supply and demand curves intersect. It's the prevailing market price that clears the market. This price is the horizontal line forming the upper boundary of the producer surplus area.
-
The Supply Curve: This upward-sloping curve represents the minimum price producers are willing to accept for each unit of the good. It forms the lower boundary of the producer surplus area.
-
The Equilibrium Quantity: This is the quantity of goods traded at the equilibrium price. It is the point on the horizontal axis where the supply and demand curves intersect. This defines the horizontal extent of the producer surplus area.
Therefore, the producer surplus at equilibrium is represented by the area of the triangle below the equilibrium price line and above the supply curve. This triangle visually captures the total benefit producers gain from participating in the market at the equilibrium price.
Calculating Producer Surplus
The area of the producer surplus triangle can be calculated using the standard formula for the area of a triangle:
Producer Surplus = 0.5 * Base * Height
Where:
- Base: The equilibrium quantity.
- Height: The difference between the equilibrium price and the price at which the supply curve intersects the vertical axis (the vertical intercept of the supply curve). This vertical intercept represents the minimum price a producer would accept for the first unit sold.
It's important to note that the precise calculation depends on the specific shape and equation of the supply curve. Linear supply curves make calculations simpler, while non-linear supply curves necessitate more complex integration techniques. However, the fundamental principle of the area below the price line and above the supply curve remains constant.
Changes in Equilibrium and Producer Surplus
Market forces constantly shift the supply and demand curves, leading to changes in the equilibrium price and quantity, and consequently, affecting producer surplus. Several factors influence these shifts:
-
Changes in Input Prices: An increase in input prices (like raw materials or labor) shifts the supply curve to the left, resulting in a higher equilibrium price and a lower equilibrium quantity. This typically leads to a reduction in producer surplus. Conversely, a decrease in input prices shifts the supply curve to the right, generally increasing producer surplus.
-
Technological Advancements: Technological improvements generally lower the cost of production, shifting the supply curve to the right. This typically increases the equilibrium quantity and decreases the equilibrium price, potentially leading to a net increase or decrease in producer surplus depending on the magnitude of these changes. The effect on producer surplus depends on the price elasticity of supply.
-
Government Regulations: Taxes and subsidies significantly impact producer surplus. Taxes shift the supply curve to the left, reducing the equilibrium quantity and increasing the equilibrium price paid by consumers but reducing the price received by producers, thereby decreasing producer surplus. Subsidies, conversely, shift the supply curve to the right, increasing equilibrium quantity and producer surplus.
-
Changes in Consumer Preferences: A shift in consumer demand will affect the equilibrium price and quantity, which in turn directly affects producer surplus. Increased demand will generally lead to a higher equilibrium price and quantity, resulting in a larger producer surplus.
Importance of Producer Surplus in Economic Analysis
Understanding producer surplus is crucial for several reasons:
-
Market Efficiency: A high level of producer surplus indicates a more efficient market allocation of resources. Efficient markets maximize the total welfare of both producers and consumers.
-
Policy Evaluation: Government policies, such as taxes and subsidies, can significantly impact producer surplus. Analyzing the effects of such policies on producer surplus helps policymakers evaluate their overall welfare implications.
-
Business Decision-Making: Firms can use the concept of producer surplus to inform their pricing and output decisions, optimizing their profitability in the market.
-
Welfare Economics: Producer surplus is a key component in measuring economic welfare and societal well-being. It reflects the benefits producers receive from participating in the market.
-
Comparative Statics: By analyzing the changes in the producer surplus area after a change in market conditions, we can perform comparative statics analysis and ascertain the impact of such changes on producers.
Producer Surplus and Related Concepts
Producer surplus is closely related to other crucial economic concepts:
-
Consumer Surplus: This represents the difference between the price consumers pay for a good and the maximum price they would be willing to pay. Both consumer and producer surplus are integral components of total economic welfare.
-
Economic Welfare (Total Surplus): This is the sum of consumer surplus and producer surplus, representing the overall benefit to society from the market exchange. Market efficiency is characterized by maximizing total surplus.
-
Deadweight Loss: This represents the loss of economic efficiency that can occur when equilibrium for a good or service is not Pareto optimal. It's the reduction in total surplus (consumer surplus + producer surplus) resulting from market inefficiencies like taxes, subsidies, or monopolies.
Conclusion
In conclusion, at equilibrium, producer surplus is visually represented by the area below the market price line and above the supply curve. Understanding this graphical representation is paramount to comprehending the benefits producers receive from participating in the market. Calculating producer surplus, analyzing changes in equilibrium, and recognizing its relationship with other economic concepts, like consumer surplus and total welfare, provides invaluable insights into market dynamics, government policy, and the overall economic well-being of producers and society as a whole. The ability to analyze the area representing producer surplus allows for a more comprehensive understanding of market mechanisms and the impact of various factors influencing equilibrium. This knowledge is crucial for economists, policymakers, and business professionals alike.
Latest Posts
Latest Posts
-
A Dwindling Population Of 1000 Frogs
Mar 31, 2025
-
A Monopolist Does Not Have A Supply Curve Because
Mar 31, 2025
-
The Maturity Date Of A Note Receivable
Mar 31, 2025
-
The Area Labeled A Contains The
Mar 31, 2025
-
Ethics And College Student Life 3rd Edition
Mar 31, 2025
Related Post
Thank you for visiting our website which covers about At Equilibrium Producer Surplus Is Represented By The Area . We hope the information provided has been useful to you. Feel free to contact us if you have any questions or need further assistance. See you next time and don't miss to bookmark.
