Which Of The Following Describes A Budget Line
Holbox
Mar 13, 2025 · 7 min read
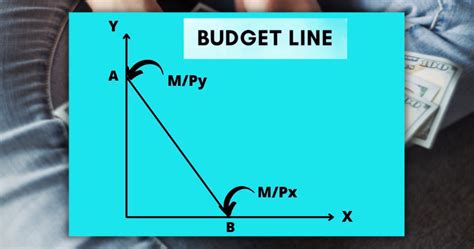
Table of Contents
- Which Of The Following Describes A Budget Line
- Table of Contents
- Which of the following describes a budget line? A Comprehensive Guide
- Defining the Budget Line: A Graphical Representation of Consumer Choices
- Key Components of the Budget Line:
- The Slope of the Budget Line: The Opportunity Cost
- Budget Line vs. Other Economic Concepts: Distinguishing Key Differences
- Budget Line vs. Indifference Curves:
- Budget Line vs. Production Possibility Frontier (PPF):
- Real-World Applications of the Budget Line:
- Shifting the Budget Line: Effects of Changes in Income and Prices
- Changes in Income:
- Changes in Prices:
- Frequently Asked Questions (FAQs) about Budget Lines:
- Conclusion: A Cornerstone of Economic Understanding
- Latest Posts
- Related Post
Which of the following describes a budget line? A Comprehensive Guide
Understanding budget lines is crucial for anyone studying economics, finance, or even just trying to manage their personal finances effectively. This comprehensive guide will delve deep into the concept of a budget line, exploring its definition, components, implications, and how it differs from other economic concepts. We'll also examine real-world applications and address frequently asked questions.
Defining the Budget Line: A Graphical Representation of Consumer Choices
A budget line, also known as a budget constraint, is a graphical representation of all the possible combinations of two goods that a consumer can afford given their income and the prices of the goods. It illustrates the trade-offs a consumer must make when deciding how to allocate their limited resources.
Think of it as a boundary: everything on or below the line is affordable; everything above the line is unaffordable. The line itself represents the maximum amount the consumer can spend, utilizing their entire income.
Key Components of the Budget Line:
-
Income (M): This represents the consumer's total disposable income available for spending on the two goods. A higher income shifts the budget line outwards, allowing for greater consumption possibilities. A lower income shifts it inwards, restricting choices.
-
Prices of Goods (P1 and P2): These are the prices of the two goods being considered. Changes in the price of either good will alter the slope and position of the budget line. An increase in the price of one good will rotate the line inwards (making less of that good affordable), while a decrease will rotate it outwards.
-
The Equation of the Budget Line: The budget line is represented mathematically by the equation:
M = P1X1 + P2X2- Where:
M= IncomeP1= Price of good 1X1= Quantity of good 1P2= Price of good 2X2= Quantity of good 2
- Where:
This equation simply states that total expenditure on both goods (P1X1 + P2X2) must equal or be less than the consumer's income (M).
The Slope of the Budget Line: The Opportunity Cost
The slope of the budget line represents the opportunity cost of consuming one good in terms of the other. It shows the rate at which the consumer must give up units of one good to obtain an additional unit of the other, while remaining within their budget.
The slope is calculated as: -P1/P2. The negative sign indicates the inverse relationship – to get more of one good, you must sacrifice some of the other.
Example: If the price of good 1 is $10 and the price of good 2 is $5, the slope is -2. This means that for every additional unit of good 1 the consumer buys, they must give up 2 units of good 2 to stay within their budget.
Budget Line vs. Other Economic Concepts: Distinguishing Key Differences
It's crucial to differentiate the budget line from other related economic concepts:
Budget Line vs. Indifference Curves:
While both are graphical tools used in consumer theory, they serve different purposes:
- Budget Line: Shows what the consumer can afford. It's objective and based on income and prices.
- Indifference Curves: Show what the consumer prefers. They represent different combinations of goods that provide the consumer with the same level of satisfaction (utility). They are subjective and based on individual preferences.
The combination of budget lines and indifference curves helps determine the consumer's optimal consumption bundle – the point where the highest possible indifference curve is tangent to the budget line. This point represents the combination of goods that maximizes the consumer's utility given their budget constraint.
Budget Line vs. Production Possibility Frontier (PPF):
The PPF is a similar graphical tool but applies to production rather than consumption:
- Budget Line: Represents the consumer's constraints on consumption.
- PPF: Represents the production possibilities of an economy or a firm, showing the maximum combination of two goods that can be produced given available resources and technology.
Both concepts illustrate trade-offs, but the budget line focuses on individual consumer choices, whereas the PPF focuses on the overall production capacity of an economy.
Real-World Applications of the Budget Line:
The budget line isn't just a theoretical concept; it has numerous practical applications:
-
Personal Finance: Individuals can use a budget line to visualize their spending choices and make informed decisions about allocating their income between different needs and wants. Budgeting apps often incorporate similar principles.
-
Business Decisions: Firms use similar concepts to analyze production possibilities and resource allocation, although they generally use more complex models.
-
Government Policy: Governments use budget lines (or their extensions) to model the impact of policies like taxes and subsidies on consumer behavior and market outcomes. For example, an increase in sales tax on a specific good would effectively rotate the budget line inwards for that good.
-
International Trade: Budget lines can be used to analyze the gains from trade, showing how access to international markets can expand a country's consumption possibilities.
Shifting the Budget Line: Effects of Changes in Income and Prices
Changes in income or prices significantly impact the budget line:
Changes in Income:
- Increase in Income: The budget line shifts outwards, parallel to the original line. The consumer can now afford more of both goods.
- Decrease in Income: The budget line shifts inwards, parallel to the original line. The consumer can now afford less of both goods.
Changes in Prices:
- Increase in the Price of Good 1: The budget line rotates inwards, pivoting on the intercept with the X2 axis (the quantity of good 2). The consumer can afford less of good 1.
- Decrease in the Price of Good 1: The budget line rotates outwards, pivoting on the intercept with the X2 axis. The consumer can afford more of good 1.
- Similar changes occur if the price of good 2 changes, with the pivot point being the intercept with the X1 axis.
Frequently Asked Questions (FAQs) about Budget Lines:
Q: Can a budget line have a positive slope?
A: No. A positive slope would imply that you can get more of both goods simultaneously, which contradicts the concept of scarcity and limited resources. The negative slope reflects the trade-off inherent in allocating limited resources.
Q: What happens if the price of one good is zero?
A: The budget line becomes horizontal or vertical, depending on which good's price is zero. If the price of good 1 is zero, the line will be horizontal, indicating the consumer can consume as much of good 1 as they want without affecting their consumption of good 2 (within their budget).
Q: How does the budget line incorporate consumer preferences?
A: The budget line itself doesn't incorporate consumer preferences. It simply shows what's affordable. To incorporate preferences, you need to combine the budget line with indifference curves. The optimal consumption bundle is where the highest attainable indifference curve is tangent to the budget line.
Q: What are the limitations of using budget lines?
A: Budget lines are simplified models. They assume:
- Consumers are perfectly rational.
- There are only two goods being considered.
- Prices are fixed and known.
- Consumer income is fixed.
In reality, these assumptions may not always hold. However, despite these limitations, budget lines provide a valuable framework for understanding basic consumer behavior and resource allocation.
Conclusion: A Cornerstone of Economic Understanding
The budget line is a fundamental concept in economics, providing a powerful visual and mathematical representation of consumer choices under budget constraints. Understanding its components, implications, and applications is essential for anyone seeking a deeper comprehension of economic principles, personal finance management, or business decision-making. By mastering this concept, you gain a valuable tool for analyzing trade-offs, optimizing resource allocation, and navigating the complexities of economic interactions. Remember to combine the budget line with indifference curve analysis to achieve a complete understanding of consumer choice theory.
Latest Posts
Related Post
Thank you for visiting our website which covers about Which Of The Following Describes A Budget Line . We hope the information provided has been useful to you. Feel free to contact us if you have any questions or need further assistance. See you next time and don't miss to bookmark.