What Do Your Results Indicate About Cell Cycle Control
Holbox
Mar 17, 2025 · 6 min read
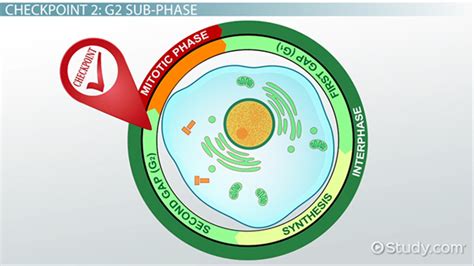
Table of Contents
What Do Your Results Indicate About Cell Cycle Control?
Cell cycle control is a fundamental process governing the growth and division of cells. Disruptions to this tightly regulated system can lead to a range of consequences, from developmental defects to uncontrolled cell proliferation and cancer. Analyzing experimental results related to the cell cycle requires a thorough understanding of the key checkpoints and regulatory mechanisms involved. This article delves into the interpretation of various experimental results, providing a framework for understanding what your data might reveal about cell cycle control.
Understanding the Cell Cycle and its Checkpoints
Before interpreting any results, a firm grasp of the cell cycle itself is crucial. The cell cycle consists of several distinct phases:
- G1 (Gap 1): The cell grows in size, synthesizes proteins and organelles, and prepares for DNA replication. This phase is crucial for assessing environmental conditions and deciding whether to proceed with cell division.
- S (Synthesis): DNA replication occurs, creating two identical copies of each chromosome. Accurate replication is vital to prevent errors that could lead to mutations.
- G2 (Gap 2): The cell continues to grow, synthesizes proteins needed for mitosis, and prepares for cell division. Another checkpoint ensures that DNA replication was successful and that the cell is ready for mitosis.
- M (Mitosis): The cell divides into two daughter cells, each receiving a complete set of chromosomes. This phase encompasses several stages: prophase, prometaphase, metaphase, anaphase, telophase, and cytokinesis.
Key Checkpoints: The cell cycle is not a linear progression but is punctuated by crucial checkpoints that ensure the integrity of the process. These checkpoints monitor:
- G1 Checkpoint (Restriction Point): This checkpoint decides whether the cell proceeds to S phase. It assesses cell size, nutrient availability, and DNA damage.
- G2 Checkpoint: This checkpoint verifies that DNA replication was completed successfully and that the cell is ready for mitosis. It also checks for DNA damage.
- M Checkpoint (Spindle Checkpoint): This checkpoint ensures that all chromosomes are properly attached to the mitotic spindle before anaphase begins. This prevents improper chromosome segregation, which can lead to aneuploidy (an abnormal number of chromosomes).
Interpreting Experimental Results: A Case-by-Case Approach
The interpretation of experimental results relating to cell cycle control depends heavily on the specific experimental design. Here, we'll explore several common experimental approaches and how to interpret their findings:
1. Flow Cytometry Analysis
Flow cytometry is a powerful technique used to analyze the cell cycle distribution. It measures the DNA content of individual cells, allowing researchers to determine the percentage of cells in each phase of the cell cycle (G1, S, G2, and M).
- Increased G1 Population: This indicates a potential blockage or delay in the G1 phase, possibly due to growth factor deprivation, DNA damage, or problems with cell size regulation.
- Increased S Population: This suggests that cells are actively replicating their DNA, potentially due to the presence of growth factors or mitogens.
- Increased G2 Population: A larger G2 population could indicate a delay or blockage at the G2 checkpoint, possibly due to incomplete DNA replication or DNA damage.
- Increased M Population: This can suggest a problem at the M checkpoint, potentially due to problems with spindle attachment or chromosome segregation.
- Sub-G1 Population: The presence of a sub-G1 population indicates apoptotic (programmed cell death) cells, suggesting that DNA damage has exceeded repair capabilities and initiated cell death.
2. Immunoblotting (Western Blotting)
Immunoblotting detects the presence and levels of specific proteins involved in cell cycle regulation. Analyzing the expression levels of key cell cycle regulators can provide insights into the control mechanisms.
- Cyclins: Cyclins are regulatory proteins that fluctuate in concentration throughout the cell cycle, activating cyclin-dependent kinases (CDKs). Changes in cyclin levels can indicate progression or arrest at specific checkpoints. For example, high levels of cyclin D could indicate progression through G1, while low levels of cyclin B could indicate a block in mitosis.
- Cyclin-Dependent Kinases (CDKs): CDKs are enzymes that phosphorylate target proteins, driving cell cycle progression. Changes in CDK activity or levels reflect cell cycle progression or arrest.
- CDK Inhibitors (CKIs): CKIs inhibit CDK activity, arresting cell cycle progression. Increased CKI levels could indicate a response to DNA damage or other stress signals.
- Tumor Suppressors (e.g., p53, Rb): These proteins regulate cell cycle progression and prevent uncontrolled cell growth. Loss or reduced expression of these proteins could indicate a potential for uncontrolled cell division.
3. Immunofluorescence Microscopy
This technique allows for the visualization of specific proteins within cells, providing spatial information about their localization and distribution.
- Cyclin localization: Observing the subcellular localization of cyclins at different cell cycle stages reveals the spatial regulation of cell cycle progression.
- Phosphorylation status: Immunofluorescence can also be used to detect the phosphorylation status of proteins involved in cell cycle regulation. Changes in phosphorylation can reflect activation or inactivation of these proteins.
- Chromosome alignment: Visualization of chromosome alignment during mitosis can reveal whether the spindle checkpoint is functioning properly. Misaligned chromosomes could indicate problems with the spindle checkpoint.
4. Cell Viability Assays
These assays measure cell proliferation and survival. Changes in cell viability could reflect the effects of cell cycle perturbations.
- MTT assay: Measures mitochondrial function, reflecting cell metabolic activity and viability.
- Colony formation assay: Measures the ability of cells to form colonies, indicating their proliferative capacity.
- Apoptosis assays: Detect the presence of apoptotic cells, indicating programmed cell death due to cell cycle dysregulation.
5. Genetic Manipulation Experiments
These experiments involve altering the expression of specific genes involved in cell cycle control using techniques like siRNA, shRNA, or CRISPR-Cas9. The effects of these manipulations on cell cycle progression can provide crucial insights into the roles of these genes.
- Knockdown experiments: Reducing the expression of a specific gene allows researchers to investigate its function in cell cycle control. A delay or arrest in the cell cycle could indicate that the gene is necessary for cell cycle progression.
- Overexpression experiments: Increasing the expression of a gene can reveal its potential to affect cell cycle progression. An acceleration of the cell cycle could indicate that the gene promotes cell proliferation.
Putting it All Together: Integrating Results for a Comprehensive Understanding
Interpreting the results of cell cycle experiments requires integrating data from multiple assays. For instance, observing an increased G2 population in flow cytometry analysis should be considered alongside immunoblotting data showing increased levels of a CKI or decreased levels of cyclin B. This combined information would point to a block at the G2 checkpoint, potentially due to DNA damage or problems with the mechanisms regulating entry into mitosis.
Similarly, if a genetic manipulation experiment shows that knocking down a specific gene causes a delay in G1 progression, immunofluorescence might reveal changes in the localization or phosphorylation status of related proteins.
Crucially, consider:
- Controls: Appropriate controls (untreated cells or cells treated with known cell cycle inhibitors/activators) are essential for validating experimental findings.
- Statistical significance: Statistical analysis is critical to determine if the observed changes are meaningful and not due to random variation.
- Potential confounding factors: Consider any potential confounding factors that could affect the results, such as cell type, experimental conditions, and variations in data collection and analysis.
Conclusion: A Holistic Approach to Understanding Cell Cycle Control
Analyzing results related to cell cycle control requires a multi-faceted approach. By carefully considering data from various experimental techniques, researchers can obtain a comprehensive picture of the cell cycle's regulation and the potential impact of perturbations to this intricate process. This holistic understanding is critical for furthering our knowledge of fundamental biology and for developing novel therapeutic strategies targeting cancer and other diseases caused by cell cycle dysregulation. Remember that careful experimental design, rigorous data analysis, and a thorough understanding of cell cycle mechanisms are key to successful interpretation and meaningful conclusions.
Latest Posts
Latest Posts
-
Draw The Shear And Moment Diagrams For The Beam Chegg
Mar 18, 2025
-
Draw The Shear Diagram For The Beam Chegg
Mar 18, 2025
-
Eating Soup That Has Been Time Temperature Abused Can Result In
Mar 18, 2025
-
Can You Write In Books Rented From Chegg
Mar 18, 2025
-
Which Of The Following Is A Characteristic Of Monopolistic Competition
Mar 18, 2025
Related Post
Thank you for visiting our website which covers about What Do Your Results Indicate About Cell Cycle Control . We hope the information provided has been useful to you. Feel free to contact us if you have any questions or need further assistance. See you next time and don't miss to bookmark.
