The Similarities And Differences Between Correlation And Regression Chegg
Holbox
Mar 16, 2025 · 6 min read
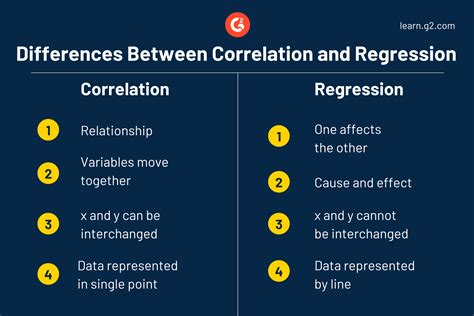
Table of Contents
Correlation vs. Regression: Unveiling the Similarities and Differences
Correlation and regression are fundamental statistical concepts often used interchangeably, leading to confusion. While closely related, they serve distinct purposes and offer different insights into the relationship between variables. This in-depth exploration will delve into the similarities and differences between correlation and regression, clarifying their applications and interpretations. We'll explore both conceptually and through practical examples, ensuring a comprehensive understanding of these crucial statistical tools.
Similarities Between Correlation and Regression
At their core, both correlation and regression analyze the relationship between two or more variables. They both aim to understand how changes in one variable (the independent or predictor variable) are associated with changes in another (the dependent or response variable). Here's a breakdown of their shared characteristics:
-
Investigate Relationships: Both methods are designed to quantify the strength and direction of a relationship between variables. They help us move beyond simple observation to a more precise understanding of how variables interact.
-
Data Dependence: Both correlation and regression analysis require data sets containing measurements for the variables under investigation. The quality and nature of this data significantly impact the reliability of the results.
-
Foundation in Scatter Plots: While not explicitly required, visualizing the data using scatter plots is highly beneficial for both techniques. Scatter plots help to identify potential outliers, nonlinear relationships, and the overall trend in the data. This visual inspection guides the choice of appropriate analysis and interpretation.
Differences Between Correlation and Regression
Despite their shared goal of understanding relationships, correlation and regression differ significantly in their objectives, methods, and interpretations. These differences are crucial for applying these techniques correctly.
1. Objective: Describing vs. Predicting
-
Correlation: Primarily aims to quantify the strength and direction of the linear relationship between two variables. It measures the degree of association but doesn't imply causation. The correlation coefficient (typically 'r') ranges from -1 to +1, with 0 indicating no linear relationship.
-
Regression: Aims to model the relationship between variables to predict the value of the dependent variable based on the value of the independent variable(s). It focuses on establishing a predictive equation.
2. Method: Measuring Association vs. Building a Model
-
Correlation: Employs a single metric (the correlation coefficient) to summarize the relationship. It doesn't inherently create a mathematical equation to predict one variable from another.
-
Regression: Involves fitting a line (or a more complex curve) to the data points to establish a mathematical model. This model can then be used to predict the dependent variable for new values of the independent variable. Linear regression, the most common type, finds the line of best fit that minimizes the sum of squared differences between the observed and predicted values.
3. Interpretation: Strength of Association vs. Prediction Accuracy
-
Correlation: The correlation coefficient's magnitude indicates the strength of the linear relationship (closer to 1 or -1 indicates a stronger relationship), and its sign indicates the direction (positive or negative). Interpreting correlation requires considering the context and potential confounding factors.
-
Regression: The results are interpreted in terms of the model's predictive power. Key metrics include the R-squared value (which represents the proportion of variance in the dependent variable explained by the independent variable(s)) and the significance of the regression coefficients. A high R-squared indicates a good fit, implying the model accurately predicts the dependent variable. The regression coefficients quantify the change in the dependent variable associated with a unit change in the independent variable(s).
4. Number of Variables: Bivariate vs. Multivariate
-
Correlation: Often used for exploring the relationship between two variables (bivariate correlation). However, it can be extended to analyze relationships among multiple variables (partial correlation, canonical correlation).
-
Regression: Can handle multiple independent variables (multiple linear regression) to build a more comprehensive predictive model. This allows for the investigation of the individual and combined effects of multiple predictors on the dependent variable. It can also be extended to handle non-linear relationships and categorical variables.
5. Causation: Correlation does not equal causation
-
Correlation: Only measures association; it does not imply causation. A strong correlation between two variables doesn't necessarily mean that one causes the other. There could be a third, unmeasured variable influencing both.
-
Regression: While regression aims to build a predictive model, it also doesn't inherently prove causation. A significant regression coefficient simply indicates that changes in the independent variable are associated with changes in the dependent variable, but doesn't definitively prove a causal link. Establishing causality requires careful experimental design and consideration of potential confounding factors.
Practical Examples: Illustrating the Differences
Let's consider two scenarios to further illustrate the differences between correlation and regression:
Scenario 1: Ice Cream Sales and Temperature
Imagine analyzing the relationship between daily ice cream sales and daily temperature.
-
Correlation: We could calculate the correlation coefficient to determine the strength and direction of the linear relationship. A strong positive correlation would suggest that as temperature increases, ice cream sales tend to increase. However, correlation alone wouldn't tell us why this is the case.
-
Regression: We could build a regression model to predict ice cream sales based on temperature. The model would give us an equation that estimates sales for any given temperature. This would be useful for businesses to forecast sales based on weather predictions.
Scenario 2: Student Study Time and Exam Scores
Let's analyze the relationship between the amount of time students spend studying and their exam scores.
-
Correlation: We would calculate the correlation coefficient to measure the strength of the linear association between study time and exam scores. A positive correlation would suggest that more study time is associated with higher scores.
-
Regression: We would build a regression model to predict exam scores based on study time. This model could be used to estimate the expected score for a given amount of study time. It might also reveal whether the relationship is linear or if there are diminishing returns to increased study time.
Advanced Regression Techniques
While linear regression is widely used, several advanced techniques cater to more complex scenarios:
- Polynomial Regression: Models non-linear relationships between variables using polynomial functions.
- Logistic Regression: Predicts the probability of a categorical outcome (e.g., success/failure, yes/no) based on one or more predictor variables.
- Ridge and Lasso Regression: Handle multicollinearity (high correlation between predictor variables) by shrinking regression coefficients.
- Support Vector Regression (SVR): A powerful technique for non-linear regression problems.
Conclusion: Choosing the Right Tool
The choice between correlation and regression depends on the research question and objectives. Correlation is suitable for exploring the strength and direction of the linear relationship between variables, while regression is appropriate for building predictive models and understanding the nature of the relationship in more detail. It's crucial to remember that correlation does not imply causation, and regression results should be interpreted cautiously considering the limitations of the model and the data. By carefully understanding their similarities and differences, researchers can harness the power of both correlation and regression to gain valuable insights from their data. The choice between them should always be guided by the specific aims of the analysis. Accurate interpretation and careful consideration of the context are vital for deriving meaningful conclusions from either analysis.
Latest Posts
Latest Posts
-
When The Simcell Membrane In The Cell O Scope
Mar 16, 2025
-
A Food Handler May Chew Tobacco In
Mar 16, 2025
-
Thomas P Edmonds Survey Of Accounting
Mar 16, 2025
-
Determine The Mass Of The Block At D
Mar 16, 2025
-
Match Each Term To Its Definition
Mar 16, 2025
Related Post
Thank you for visiting our website which covers about The Similarities And Differences Between Correlation And Regression Chegg . We hope the information provided has been useful to you. Feel free to contact us if you have any questions or need further assistance. See you next time and don't miss to bookmark.
