The Percent Frequency Of A Class Is Computed By
Holbox
Mar 18, 2025 · 5 min read
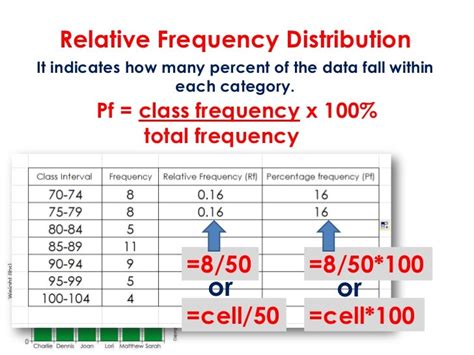
Table of Contents
Understanding and Calculating Percent Frequency: A Comprehensive Guide
Percent frequency, a fundamental concept in statistics, represents the relative proportion of each category or class within a dataset as a percentage of the total. It provides a clear and concise way to visualize and interpret the distribution of data, making it easier to understand patterns and trends. This comprehensive guide will delve into the intricacies of calculating percent frequency, exploring its applications, variations, and significance in data analysis.
What is Percent Frequency?
Percent frequency, also known as relative frequency expressed as a percentage, shows the percentage of observations that fall into each class or category in a frequency distribution. Unlike simple frequency counts, which only tell us how many observations are in each category, percent frequency provides a normalized measure, allowing for easier comparison across datasets of different sizes. This makes it invaluable for comparing distributions, identifying dominant categories, and drawing meaningful inferences from data.
Imagine you're analyzing customer preferences for different ice cream flavors. A simple frequency count might tell you that 100 people chose chocolate, 50 chose vanilla, and 25 chose strawberry. However, percent frequency puts this into perspective: it shows the proportion of customers preferring each flavor relative to the total number of customers. This helps in understanding market share, popular choices, and planning inventory.
Calculating Percent Frequency: Step-by-Step
Calculating percent frequency is a straightforward process, typically involving these steps:
-
Determine the Frequency of Each Class: This involves counting the number of observations that fall into each category or class within your dataset. This is your raw frequency count.
-
Calculate the Total Number of Observations: Sum up the frequencies of all classes to get the total number of observations in your data. This will be your denominator for the percentage calculation.
-
Calculate the Percent Frequency for Each Class: For each class, divide its frequency by the total number of observations and multiply the result by 100. The formula is:
(Frequency of Class / Total Number of Observations) * 100 = Percent Frequency
-
Verify the Sum: The sum of all percent frequencies should ideally equal 100% (or very close to it, accounting for possible rounding errors). This serves as a crucial check to ensure the accuracy of your calculations.
Example:
Let's consider a dataset of student grades:
| Grade | Frequency |
|---|---|
| A | 15 |
| B | 20 |
| C | 25 |
| D | 10 |
| F | 5 |
Steps:
-
Frequencies: We already have the frequencies for each grade.
-
Total Observations: 15 + 20 + 25 + 10 + 5 = 75
-
Percent Frequency Calculation:
- Grade A: (15/75) * 100 = 20%
- Grade B: (20/75) * 100 = 26.67%
- Grade C: (25/75) * 100 = 33.33%
- Grade D: (10/75) * 100 = 13.33%
- Grade F: (5/75) * 100 = 6.67%
-
Verification: 20% + 26.67% + 33.33% + 13.33% + 6.67% = 100%
Therefore, the percent frequency distribution of student grades is: A (20%), B (26.67%), C (33.33%), D (13.33%), and F (6.67%).
Applications of Percent Frequency
Percent frequency finds widespread application across various fields:
- Market Research: Analyzing consumer preferences, brand loyalty, and market share.
- Demographics: Studying population distributions by age, gender, income, etc.
- Quality Control: Assessing defect rates in manufacturing processes.
- Healthcare: Analyzing disease prevalence, treatment effectiveness, and patient demographics.
- Education: Evaluating student performance, analyzing course enrollment, and assessing teacher effectiveness.
- Social Sciences: Studying social trends, political opinions, and cultural patterns.
- Finance: Analyzing investment returns, risk profiles, and market trends.
Interpreting Percent Frequency
Understanding how to interpret percent frequency is crucial for drawing meaningful conclusions from your data. Here are some key interpretations:
-
Dominant Categories: Identify categories with high percent frequencies, representing the most prevalent or frequent occurrences in your data.
-
Proportions: Compare the relative proportions of different categories to understand their contribution to the whole.
-
Trends and Patterns: Analyze changes in percent frequency over time or across different groups to identify trends and patterns.
-
Data Comparison: Compare percent frequency distributions across different datasets to identify similarities and differences.
Percent Frequency vs. Relative Frequency
While often used interchangeably, there's a subtle difference:
-
Relative Frequency: Represents the proportion of observations in each class as a decimal (e.g., 0.20 for 20%).
-
Percent Frequency: Represents the same proportion as a percentage (e.g., 20%).
Essentially, percent frequency is simply relative frequency multiplied by 100.
Cumulative Percent Frequency
Cumulative percent frequency is a further extension of percent frequency. It shows the cumulative percentage of observations up to and including a particular class. It's particularly useful for understanding the proportion of observations below a certain threshold or for constructing cumulative frequency distributions (ogives).
To calculate cumulative percent frequency:
-
Calculate the percent frequency for each class.
-
For each class, add its percent frequency to the cumulative percent frequency of the preceding class. The first class's cumulative percent frequency is the same as its percent frequency.
Example (using the student grade data):
| Grade | Percent Frequency | Cumulative Percent Frequency |
|---|---|---|
| A | 20% | 20% |
| B | 26.67% | 46.67% (20% + 26.67%) |
| C | 33.33% | 80% (46.67% + 33.33%) |
| D | 13.33% | 93.33% (80% + 13.33%) |
| F | 6.67% | 100% (93.33% + 6.67%) |
This shows that 80% of students received a grade of C or better.
Limitations of Percent Frequency
While percent frequency is a powerful tool, it does have some limitations:
-
Masking Underlying Patterns: It may obscure important details or patterns if the data is heavily skewed or has outliers.
-
Context is Crucial: The interpretation of percent frequency heavily depends on the context of the data and the specific research question being addressed.
-
Sample Size: Percent frequency calculated from small samples may not accurately reflect the population distribution.
Conclusion
Percent frequency is an essential statistical concept for understanding data distributions. By expressing the proportion of observations in each category as a percentage, it offers a clear, concise, and easily interpretable way to analyze data. Its applications are vast, spanning various fields and research areas. Understanding its calculation, interpretation, and limitations is crucial for effective data analysis and drawing meaningful conclusions. Remember to always consider the context of your data and the specific questions you are trying to answer when interpreting percent frequency results. Mastering this technique will significantly enhance your ability to work with and understand data effectively.
Latest Posts
Latest Posts
-
An Operations Manager Is Not Likely To Be Involved In
Mar 18, 2025
-
A Guest Enjoying A Few Cocktails
Mar 18, 2025
-
Apt Was Compared With Numerous Extant Methodologies
Mar 18, 2025
-
Add The Quick Print Button To The Quick Access Toolbar
Mar 18, 2025
-
Which Of The Following Is An Advantage Of Product Departmentalization
Mar 18, 2025
Related Post
Thank you for visiting our website which covers about The Percent Frequency Of A Class Is Computed By . We hope the information provided has been useful to you. Feel free to contact us if you have any questions or need further assistance. See you next time and don't miss to bookmark.
