The Overhead Variance Is The Difference Between:
Holbox
Mar 19, 2025 · 6 min read
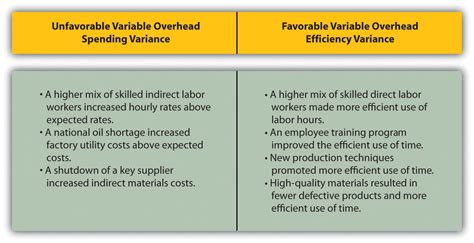
Table of Contents
The Overhead Variance: Unpacking the Difference Between Actual and Applied Overhead Costs
Understanding overhead variances is crucial for effective cost management and profitability analysis in any business. This comprehensive guide delves deep into the concept of overhead variance, exploring its various components, causes, and implications for decision-making. We'll unravel the difference between actual and applied overhead costs, examining how these discrepancies arise and how businesses can utilize this information for improved operational efficiency.
What is Overhead Variance?
Overhead variance represents the difference between the actual overhead costs incurred and the overhead costs applied to production. It's a key indicator of how effectively a company manages its indirect costs. These indirect costs, unlike direct materials and direct labor, are not easily traceable to specific products or services. They include items like factory rent, utilities, depreciation of machinery, and supervisory salaries. Understanding and analyzing this variance is vital for identifying areas of inefficiency and improving cost control.
Actual Overhead Costs vs. Applied Overhead Costs: A Closer Look
To understand the overhead variance, we need to dissect its two primary components:
1. Actual Overhead Costs:
These are the real costs incurred during a specific period in areas related to production. These are the costs that are actually paid, recorded, and documented. They reflect the total expenditure on indirect expenses. For example, this could include:
- Actual rent paid for the factory: This is a verifiable cost, recorded on your financial statements.
- Actual electricity consumed: Your utility bills provide clear evidence of actual spending.
- Actual salary paid to supervisors: Payroll records will show exact payments to supervisory personnel.
- Actual maintenance and repair costs: Invoices and repair orders are your documentation for this cost category.
2. Applied Overhead Costs:
These are the overhead costs that are assigned or allocated to products or services based on a predetermined overhead rate. This rate is calculated beforehand, usually at the beginning of an accounting period (like a month or year), based on estimated overhead costs and a chosen allocation base. Common allocation bases include:
- Direct labor hours: The more direct labor hours a product requires, the more overhead is assigned to it.
- Machine hours: This method assigns overhead based on the amount of machine time used in production.
- Direct materials costs: Overhead is allocated proportionally to the direct materials cost of each product.
The formula for calculating the applied overhead cost is:
Predetermined Overhead Rate x Actual Activity Level = Applied Overhead Cost
For example, if your predetermined overhead rate is $10 per direct labor hour, and 1000 direct labor hours were used during the month, the applied overhead cost would be $10,000.
Calculating the Overhead Variance: The Key Formula
The overhead variance is simply the difference between actual overhead costs and applied overhead costs:
Overhead Variance = Actual Overhead Costs – Applied Overhead Costs
-
Favorable Variance: If the actual overhead costs are lower than the applied overhead costs, the result is a favorable variance. This indicates that the company spent less on overhead than anticipated, potentially increasing profitability.
-
Unfavorable Variance: If the actual overhead costs are higher than the applied overhead costs, the result is an unfavorable variance. This signals that the company spent more on overhead than planned, which could negatively impact profitability.
Dissecting the Overhead Variance: Identifying the Root Causes
A simple calculation of the overhead variance is just the first step. To effectively use this information, you need to break it down further to identify the underlying reasons behind the discrepancy. This usually involves separating the overall overhead variance into two major components:
1. Spending Variance:
This component focuses solely on the difference between actual overhead costs and the budgeted overhead costs. It isolates the efficiency of managing overhead expenditures.
Spending Variance = Actual Overhead Costs – Budgeted Overhead Costs
A favorable spending variance indicates better cost control than anticipated, while an unfavorable spending variance signals potential inefficiencies or unforeseen costs. Analyzing this variance often requires a detailed review of individual overhead cost categories to pinpoint areas for improvement.
2. Volume Variance:
This variance highlights the difference between the applied overhead costs based on the predetermined overhead rate and the budgeted overhead costs. It reflects the impact of variations in the actual activity level compared to the budgeted or planned activity level.
Volume Variance = Budgeted Overhead Costs – Applied Overhead Costs
A favorable volume variance arises when the actual activity level exceeds the budgeted activity level. An unfavorable volume variance occurs when the actual activity level is lower than the budgeted level. This variance doesn't necessarily reflect inefficiency in cost management; it simply highlights the impact of production volume on overhead costs.
Analyzing and Interpreting Overhead Variances: Practical Applications
Understanding the components of overhead variance enables businesses to take proactive measures to enhance efficiency and profitability. Here's how you can use this information:
-
Investigate Unfavorable Variances: A detailed investigation is needed when an unfavorable variance arises. This involves scrutinizing individual overhead cost items to understand why they exceeded budget. Perhaps there were unexpected repairs, increased utility costs due to higher production, or inefficient use of resources.
-
Identify Areas for Improvement: Analyzing both spending and volume variances can pinpoint areas where cost reduction is possible. This could involve negotiating better deals with suppliers, implementing energy-saving measures, improving production processes to reduce waste, or adopting more efficient technologies.
-
Refine Budgeting and Forecasting: The variance analysis helps refine future budgets and forecasts. By understanding past trends and discrepancies, companies can create more accurate and realistic future budgets, which improves planning and decision-making.
-
Enhance Decision-Making: Accurate cost information, including the understanding of overhead variances, strengthens the decision-making process. It provides a clear view of the cost implications of different strategic choices, such as investing in new equipment or expanding production capacity.
Beyond the Numbers: Qualitative Factors Affecting Overhead Variance
While numerical analysis is crucial, it's essential to acknowledge the influence of qualitative factors on overhead variances. These factors can significantly impact actual overhead costs, often in ways not readily captured in simple calculations.
-
Changes in Technology: Investing in new, more efficient technology can reduce certain overhead costs, such as energy consumption. However, it might also introduce new overhead costs related to software licenses or maintenance contracts.
-
Economic Fluctuations: Changes in market conditions, interest rates, or material prices can significantly impact overhead costs, often beyond the control of the company.
-
Unexpected Events: Unforeseen events such as natural disasters, equipment breakdowns, or labor disputes can dramatically increase overhead expenses.
Minimizing Overhead Variances: Proactive Strategies
Companies can implement various strategies to minimize overhead variances and improve cost control:
-
Accurate Budgeting and Forecasting: Developing comprehensive budgets based on thorough research and realistic assumptions is vital. Regularly reviewing and adjusting the budget helps adapt to changing circumstances.
-
Efficient Resource Management: Implementing efficient resource management techniques helps optimize the utilization of resources, reducing waste and unnecessary expenses.
-
Regular Monitoring and Control: Continuous monitoring of actual overhead costs helps identify potential problems early on. Regular reviews and comparisons against budget provide early warnings of unfavorable trends.
-
Process Improvement: Regularly evaluating and improving production processes helps enhance efficiency, reduce waste, and minimize overhead costs.
Conclusion: The Importance of Understanding Overhead Variance
The overhead variance, encompassing both spending and volume variances, is a powerful tool for businesses to assess their cost management effectiveness. By systematically analyzing the variance, identifying root causes, and implementing corrective actions, companies can achieve better cost control, improve profitability, and enhance their overall operational efficiency. Remember that continuous monitoring, proactive strategies, and consideration of qualitative factors are essential for effective overhead variance management. This ensures informed decision-making and a stronger competitive position in the market.
Latest Posts
Latest Posts
-
Which Of The Following Statements Is Accurate About Airborne Transmission
Mar 19, 2025
-
The Practice Of Public Relations 14th
Mar 19, 2025
-
What Role Does Competition Play In International Trade
Mar 19, 2025
-
Yeast Have Mitochondria And Can Perform Cellular Respiration
Mar 19, 2025
-
The Term Discrimination Is Defined In The Text As
Mar 19, 2025
Related Post
Thank you for visiting our website which covers about The Overhead Variance Is The Difference Between: . We hope the information provided has been useful to you. Feel free to contact us if you have any questions or need further assistance. See you next time and don't miss to bookmark.
