The Mean Of The Sample Means
Holbox
Mar 15, 2025 · 7 min read
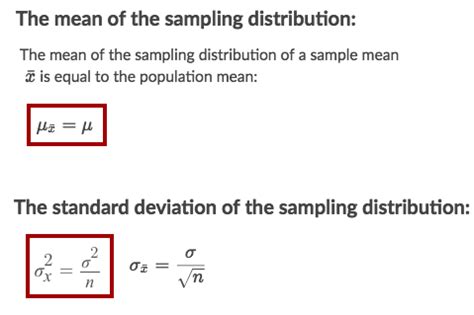
Table of Contents
The Mean of the Sample Means: Understanding the Central Limit Theorem
The mean of the sample means, also known as the expected value of the sample mean, is a fundamental concept in statistics with far-reaching implications for data analysis and inference. Understanding this concept is crucial for grasping the power and limitations of statistical methods used in various fields, from scientific research to business decision-making. This article delves deep into the mean of sample means, explaining its calculation, significance, and relationship to the Central Limit Theorem (CLT).
What is the Mean of the Sample Means?
Imagine you have a population of data – let's say, the heights of all students in a particular university. Calculating the population mean (µ) would involve measuring the height of every single student and averaging those measurements. However, this is often impractical or impossible. Instead, statisticians often rely on sample means. A sample is a smaller, representative subset of the population. We calculate the mean of this sample (denoted as x̄).
Now, imagine taking many, many samples from this population. Each sample will have its own mean. The mean of the sample means is simply the average of all these sample means. It's the average of the averages. This seemingly simple concept is surprisingly powerful because it connects sample statistics to population parameters.
Mathematically, if we have 'k' samples, each with a mean x̄₁, x̄₂, ..., x̄ₖ, then the mean of the sample means is:
(x̄₁ + x̄₂ + ... + x̄ₖ) / k
The Significance of the Mean of Sample Means
The true power of understanding the mean of sample means lies in its relationship to the population mean (µ). Under certain conditions, the mean of the sample means is an unbiased estimator of the population mean. This means that if we were to repeatedly take samples and calculate the mean of those sample means, the average of these averages would converge towards the true population mean. This is not just a theoretical curiosity; it's the foundation of many statistical inference techniques.
Unbiased Estimator: A Key Property
The fact that the mean of sample means is an unbiased estimator is paramount. A biased estimator consistently overestimates or underestimates the true population parameter. An unbiased estimator, on the other hand, doesn't systematically err in one direction or another. This crucial property allows us to use the mean of sample means to make inferences about the population mean with confidence, even if we can't directly measure the entire population.
Reducing Sampling Error
Sampling error is inherent in statistical sampling. Because we only observe a subset of the population, our sample mean (x̄) is unlikely to perfectly match the population mean (µ). The mean of sample means helps mitigate this error. By averaging many sample means, we effectively reduce the impact of random fluctuations present in individual sample means. The larger the number of samples, the closer the mean of sample means gets to the true population mean.
The Central Limit Theorem (CLT) and its Implications
The Central Limit Theorem (CLT) is arguably one of the most important theorems in statistics. It explains the remarkable behavior of the distribution of sample means. The CLT states that, regardless of the shape of the population distribution (provided it has a finite mean and variance), the distribution of the sample means will approach a normal distribution as the sample size increases.
Understanding the CLT's Conditions
The CLT has some key conditions:
- Sample Independence: The samples should be independent of each other. This means that the selection of one sample doesn't influence the selection of another.
- Sufficient Sample Size: While there's no universally agreed-upon minimum sample size, the rule of thumb is generally 30 or more. The larger the sample size, the better the approximation to a normal distribution. However, even for smaller sample sizes, the CLT's approximation can be surprisingly accurate.
- Finite Population Mean and Variance: The population from which samples are drawn must have a finite mean (µ) and variance (σ²).
The Power of Normality
The normality of the sampling distribution of the mean has profound implications:
- Confidence Intervals: We can construct confidence intervals around the sample mean to estimate the range within which the population mean is likely to lie. The normality assumption is crucial for the accurate calculation of these intervals.
- Hypothesis Testing: Many hypothesis tests rely on the assumption of normality. For example, t-tests and z-tests used to compare means are based on the assumption that the sampling distribution of the mean is approximately normal.
- Simplified Calculations: The normal distribution has well-established properties, which makes calculations involving sample means significantly simpler. Many statistical tables and software packages rely on the normal distribution to perform calculations efficiently.
The Mean and Standard Deviation of the Sampling Distribution
The CLT doesn't only dictate the shape of the sampling distribution of the mean; it also specifies the mean and standard deviation:
- Mean: The mean of the sampling distribution of the mean is equal to the population mean (µ).
- Standard Deviation: The standard deviation of the sampling distribution of the mean (also known as the standard error of the mean) is equal to the population standard deviation (σ) divided by the square root of the sample size (n): σ/√n. This is a critical aspect because it showcases how the variability of sample means decreases as the sample size increases. Larger samples lead to more precise estimates of the population mean.
Practical Applications and Examples
The mean of sample means and the CLT are essential in numerous real-world applications:
1. Quality Control:
In manufacturing, repeated sampling of products allows manufacturers to estimate the average quality of their output. The mean of sample means provides an estimate of the true average quality, helping manufacturers maintain consistent product standards. If the mean of sample means deviates significantly from the desired target, it signals a potential problem in the manufacturing process.
2. Public Opinion Polls:
Polls gauge public opinion by surveying a sample of the population. The mean of sample means (from repeated polls) gives a more reliable estimate of the overall sentiment than a single poll. The CLT helps determine the margin of error associated with the poll results, reflecting the uncertainty inherent in sampling.
3. Medical Research:
Clinical trials often involve multiple treatment groups. By comparing the mean of sample means for different treatments, researchers can assess the effectiveness of different interventions. The CLT allows for the statistical comparison of these means, determining whether differences are statistically significant or due to random chance.
4. Financial Modeling:
In finance, the mean of sample means is used to analyze stock returns. Repeated sampling of stock prices over various periods allows financial analysts to estimate average returns and volatility. The CLT plays a role in portfolio optimization, risk management, and option pricing.
5. Environmental Monitoring:
Monitoring environmental variables like air or water quality often involves repeated measurements at different locations. The mean of sample means provides a better estimate of the overall environmental condition than individual measurements. The CLT aids in evaluating trends and detecting changes over time.
Limitations and Considerations
While the CLT is incredibly powerful, it's crucial to understand its limitations:
- Sample Independence: If samples are not independent (e.g., data points are clustered or correlated), the CLT may not hold.
- Sample Size: While the CLT works well with larger samples, its approximation might be less accurate for small samples, especially if the population distribution is heavily skewed.
- Outliers: Extreme outliers in the population can affect the accuracy of the CLT's approximation. Robust statistical methods may be necessary in such scenarios.
- Non-finite Mean or Variance: If the population distribution lacks a finite mean or variance, the CLT may not apply. This situation is less common but is crucial to consider.
Conclusion
The mean of sample means is a cornerstone of statistical inference. Its relationship with the Central Limit Theorem provides a powerful framework for making inferences about population parameters from sample data. By understanding the conditions and limitations of the CLT, researchers and analysts can leverage this concept to draw meaningful conclusions and make informed decisions across various disciplines. The ability to accurately estimate the population mean based on sample data is fundamental to scientific progress, effective decision-making, and informed policy creation. While the mathematical underpinnings might seem complex, the core idea – averaging averages to obtain a more precise and robust estimate – is remarkably intuitive and deeply impactful in numerous fields. By embracing this understanding, we gain a much clearer perspective on the power and reliability of statistical analysis in the modern world.
Latest Posts
Latest Posts
-
An Increase In The Quantity Supplied Suggests A
Mar 15, 2025
-
Libreoffice Is An Example Of Which Type Of Software
Mar 15, 2025
-
The Cash Conversion Cycle Is Computed As
Mar 15, 2025
-
What Are Three Ways You Could Use Hootsuite Streams
Mar 15, 2025
-
If A Patient With A Chest Injury Only Inhales
Mar 15, 2025
Related Post
Thank you for visiting our website which covers about The Mean Of The Sample Means . We hope the information provided has been useful to you. Feel free to contact us if you have any questions or need further assistance. See you next time and don't miss to bookmark.
