The Marginal Cost Curve Intersects The Average Total Cost Curve
Holbox
Apr 06, 2025 · 6 min read
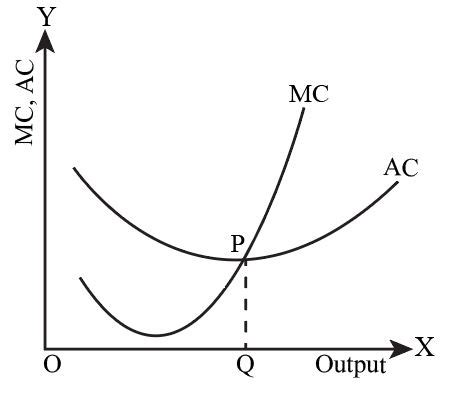
Table of Contents
- The Marginal Cost Curve Intersects The Average Total Cost Curve
- Table of Contents
- Where the Marginal Cost Curve Intersects the Average Total Cost Curve: Understanding Cost Relationships in Economics
- Understanding Marginal Cost (MC) and Average Total Cost (ATC)
- Marginal Cost (MC)
- Average Total Cost (ATC)
- The Intersection: The Significance of the Point
- Graphical Representation and Interpretation
- Implications for Firms
- Real-World Examples
- Beyond the Basics: Considering Other Cost Curves
- Conclusion: A Cornerstone of Economic Analysis
- Latest Posts
- Latest Posts
- Related Post
Where the Marginal Cost Curve Intersects the Average Total Cost Curve: Understanding Cost Relationships in Economics
The relationship between a firm's marginal cost (MC) and average total cost (ATC) curves is a fundamental concept in economics, providing crucial insights into production efficiency and cost minimization. Understanding where and why these curves intersect is key to comprehending how firms make decisions regarding output levels and pricing strategies. This article delves into the intricacies of this intersection, exploring the underlying principles and providing illustrative examples.
Understanding Marginal Cost (MC) and Average Total Cost (ATC)
Before examining their intersection, let's define each cost curve:
Marginal Cost (MC)
The marginal cost is the increase in total cost that arises from producing one more unit of output. It's calculated by finding the change in total cost divided by the change in quantity. Mathematically, MC = ΔTC/ΔQ. The MC curve reflects the cost of producing an additional unit, not the average cost of all units produced.
Average Total Cost (ATC)
The average total cost, also known as average cost (AC), represents the total cost per unit of output. It's calculated by dividing total cost (TC) by the quantity of output (Q). Mathematically, ATC = TC/Q. ATC includes both average fixed costs (AFC) and average variable costs (AVC).
The Intersection: The Significance of the Point
The marginal cost (MC) curve always intersects the average total cost (ATC) curve at the ATC's minimum point. This is not a coincidence; it's a direct consequence of the mathematical relationship between marginal and average values.
Imagine you're calculating your average test score. If your next test score (the marginal score) is higher than your current average, your average will increase. Conversely, if your next test score (the marginal score) is lower than your current average, your average will decrease. The same principle applies to cost curves.
-
When MC < ATC: If the cost of producing one more unit (MC) is less than the average cost of all units produced (ATC), then adding that unit will lower the average cost. Think of it as a "high-achieving" unit pulling the average down. This explains why the ATC curve is falling when MC is below it.
-
When MC > ATC: If the cost of producing one more unit (MC) is greater than the average cost of all units produced (ATC), then adding that unit will raise the average cost. This is like a "low-achieving" unit pulling the average up. The ATC curve rises when MC is above it.
-
When MC = ATC: The only point where the addition of a unit neither raises nor lowers the average is when the marginal cost equals the average cost. This is the minimum point of the ATC curve. Adding a unit at this point leaves the average unchanged.
Graphical Representation and Interpretation
The graphical representation clearly illustrates this relationship. The ATC curve is typically U-shaped, reflecting economies and diseconomies of scale. The MC curve intersects the ATC curve at the lowest point of the U-shape.
[Insert a graph here showing a typical U-shaped ATC curve and an upward-sloping MC curve intersecting the ATC curve at its minimum point. Label the axes clearly (Quantity, Cost) and the curves (MC, ATC). This graph is crucial for visual understanding.]
Key observations from the graph:
-
Initially Decreasing ATC: At low levels of output, the MC curve lies below the ATC curve. This indicates that adding more units reduces the average total cost, reflecting economies of scale (e.g., spreading fixed costs over more units).
-
Minimum ATC: The MC curve intersects the ATC curve at the minimum point of the ATC curve. At this point, the average total cost is minimized.
-
Increasing ATC: Beyond the minimum point, the MC curve lies above the ATC curve. Adding more units increases the average total cost, reflecting diseconomies of scale (e.g., coordination difficulties, management inefficiencies).
Implications for Firms
Understanding the intersection of MC and ATC has several important implications for firms:
-
Cost Minimization: Firms aim to minimize their average total cost. The intersection point of MC and ATC indicates the output level where this minimum is achieved.
-
Production Decisions: Firms will typically produce at an output level where MC = MR (marginal revenue), maximizing profit. The relationship between MC and ATC helps firms understand the cost implications of different production levels.
-
Pricing Strategies: The cost structure, including the ATC and MC, influences a firm's pricing decisions. Firms must price their products to cover their costs and ideally generate a profit.
-
Long-Run Planning: The long-run average cost (LRAC) curve is also relevant, showing the minimum average cost for different plant sizes. Understanding the short-run MC and ATC helps firms make optimal long-run decisions regarding capacity and scale.
Real-World Examples
While it's difficult to provide precise numerical examples without specific firm data, we can use hypothetical scenarios to illustrate the principles:
Example 1: A bakery
Imagine a small bakery. Initially, as they increase production (e.g., from 100 to 200 loaves of bread), their marginal cost might be low due to efficient use of existing equipment. This would lower their average total cost. However, beyond a certain point, producing more loaves (e.g., 500 to 600) might require hiring additional staff, buying more ovens, or renting a larger space – increasing their marginal cost significantly. This increase in marginal cost would pull the average total cost upwards. The intersection point represents the optimal production level where the bakery minimizes its average cost per loaf.
Example 2: A software company
A software company developing a new app might experience similar cost dynamics. Initially, the cost of adding new features (marginal cost) is low, improving the average cost of the app's development. However, as the app becomes more complex, adding features requires more programming time, testing, and potentially additional developers – leading to increased marginal cost. The intersection point signifies the point of optimal feature addition, minimizing the average cost per feature.
Beyond the Basics: Considering Other Cost Curves
While the MC-ATC intersection is a central concept, it's important to consider other cost curves to gain a comprehensive understanding of firm costs. These include:
-
Average Fixed Cost (AFC): AFC declines continuously as output increases, as fixed costs are spread over more units.
-
Average Variable Cost (AVC): AVC typically follows a U-shape, similar to ATC, reflecting increasing and decreasing marginal returns.
-
Average Variable Cost (AVC): AVC typically follows a U-shape, similar to ATC, reflecting increasing and decreasing marginal returns.
The relationship between MC, ATC, AVC, and AFC provides a more complete picture of a firm's cost structure and guides its production decisions.
Conclusion: A Cornerstone of Economic Analysis
The point where the marginal cost curve intersects the average total cost curve is a crucial element in understanding the cost structure of firms and their production decisions. It highlights the dynamic interplay between adding units of output and the impact on average costs. Recognizing the implications of this intersection – including cost minimization, production levels, and pricing strategies – is essential for anyone seeking a deeper understanding of microeconomic principles and business operations. Mastering this concept provides a strong foundation for further exploration of more complex economic models and real-world business scenarios.
Latest Posts
Latest Posts
-
When A Lease Is Classified As An Operating Lease
Apr 12, 2025
-
Creatine Phosphate Functions In The Muscle Cell By
Apr 12, 2025
-
Name The Cycloalkenes Using Systematic Names
Apr 12, 2025
-
Which Statement Accurately Describes The Tympanic Membrane
Apr 12, 2025
-
Economists Assume That Peoples Goals Are To
Apr 12, 2025
Related Post
Thank you for visiting our website which covers about The Marginal Cost Curve Intersects The Average Total Cost Curve . We hope the information provided has been useful to you. Feel free to contact us if you have any questions or need further assistance. See you next time and don't miss to bookmark.