The Four Ms Of Cause And Effect Diagrams Are
Holbox
Mar 30, 2025 · 7 min read
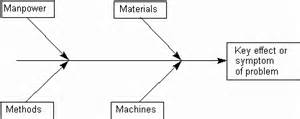
Table of Contents
- The Four Ms Of Cause And Effect Diagrams Are
- Table of Contents
- The Four Ms of Cause and Effect Diagrams: A Comprehensive Guide to Problem Solving
- Understanding the Four Ms of Cause and Effect Diagrams
- 1. Manpower (People)
- 2. Machines (Equipment)
- 3. Materials (Supplies)
- 4. Methods (Processes)
- Constructing an Effective Cause and Effect Diagram
- Beyond the Four Ms: Expanding Your Analysis
- Conclusion: Mastering the Four Ms for Effective Problem Solving
- Latest Posts
- Latest Posts
- Related Post
The Four Ms of Cause and Effect Diagrams: A Comprehensive Guide to Problem Solving
Cause and effect diagrams, also known as Ishikawa diagrams or fishbone diagrams, are powerful visual tools used in problem-solving and quality management. They help teams brainstorm and identify the root causes of a problem by exploring various contributing factors. While the categories used can be adapted to suit specific situations, the Four Ms – Manpower, Machines, Materials, and Methods – provide a robust framework for analyzing a wide range of issues. This comprehensive guide delves into each of the four Ms, providing practical examples and strategies for effective use in your problem-solving endeavors.
Understanding the Four Ms of Cause and Effect Diagrams
The Four Ms – Manpower, Machines, Materials, and Methods – represent four key areas that can contribute to a problem. They offer a structured approach to brainstorming, ensuring that no significant aspect is overlooked. Let's explore each 'M' in detail:
1. Manpower (People)
This category encompasses all aspects related to human involvement in the process. It's not just about the workers themselves but also their skills, training, motivation, and overall performance. Consider these sub-categories when analyzing the "Manpower" aspect:
- Skills and Training: Are employees adequately trained to perform their tasks? Do they possess the necessary skills and knowledge? Lack of training or inadequate skills can lead to errors and inefficiencies.
- Knowledge and Experience: Does the team possess the necessary expertise to handle the situation? Are there gaps in knowledge that contribute to the problem?
- Motivation and Morale: A demotivated workforce can lead to decreased productivity and an increased likelihood of errors. Low morale can stem from various factors such as poor management, lack of recognition, or stressful working conditions.
- Communication: Effective communication is crucial for smooth operations. Poor communication can lead to misunderstandings, delays, and errors.
- Workload and Staffing: Is the workload appropriately distributed among team members? Is there sufficient staffing to handle the task effectively? Overwork or understaffing can significantly contribute to problems.
- Human Error: This is a broad category encompassing mistakes, negligence, and oversight. Analyzing human error involves understanding the contributing factors and implementing preventative measures.
Example: If a product consistently fails a quality check, the "Manpower" category might reveal insufficient training on new equipment, leading to incorrect operation and defective products.
2. Machines (Equipment)
This category encompasses all machinery, equipment, tools, and technology involved in the process. The focus is on the functionality, reliability, and maintenance of these elements. Consider these sub-categories:
- Equipment Malfunction: Is the equipment malfunctioning, breaking down frequently, or operating below its optimal performance? Regular maintenance and calibration are crucial to avoid this.
- Maintenance and Calibration: Is the equipment regularly maintained and calibrated according to the manufacturer's recommendations? Neglecting maintenance can lead to breakdowns and inconsistencies.
- Technology and Software: Is the technology or software used reliable and up-to-date? Outdated systems or software bugs can cause significant problems.
- Capacity and Limitations: Does the equipment have the capacity to handle the workload? Are there limitations that are contributing to the issue?
- Design and Ergonomics: Is the equipment ergonomically designed to minimize human error and fatigue? Poor design can lead to increased error rates and safety concerns.
- Integration and Compatibility: Are different machines and systems well integrated and compatible with each other? Poor integration can cause bottlenecks and inefficiencies.
Example: A bottleneck in a manufacturing process might be attributed to an outdated machine that operates slower than the rest of the production line.
3. Materials (Supplies)
This category includes all raw materials, components, supplies, and resources used in the process. Quality, availability, and consistency are key considerations. Consider these sub-categories:
- Quality of Materials: Are the materials consistently meeting the required quality standards? Substandard materials can lead to defects and failures.
- Availability of Materials: Are materials readily available when needed? Supply chain issues can disrupt production and cause delays.
- Storage and Handling: Are materials properly stored and handled to prevent damage or degradation? Improper storage can affect the quality and usability of materials.
- Source and Supplier: Is the material sourced from a reliable supplier? Are there issues with the quality or consistency of supply from the source?
- Specifications and Standards: Do the materials meet the required specifications and industry standards? Inconsistencies in material specifications can lead to problems.
- Material Degradation: Are materials deteriorating or degrading over time, leading to problems in the process? Proper storage and handling can minimize this issue.
Example: If baked goods are consistently undercooked, the "Materials" category might reveal that the oven is not reaching the required temperature due to a faulty thermostat or that the baking powder is past its expiration date.
4. Methods (Processes)
This category focuses on the processes, procedures, and workflows used in the operation. It encompasses the overall system and how different elements interact. Consider these sub-categories:
- Process Design: Is the process efficiently designed? Are there bottlenecks or unnecessary steps? Poor process design can lead to inefficiencies and errors.
- Work Instructions and Procedures: Are clear and concise work instructions available? Are procedures consistently followed? Ambiguous or outdated procedures can cause errors.
- Workflow and Sequencing: Is the workflow logical and efficient? Are tasks sequenced effectively to minimize delays? Inefficient workflow can lead to bottlenecks and wasted resources.
- Data Collection and Analysis: Is data collected and analyzed effectively to identify trends and improve the process? Lack of data analysis can prevent the identification of root causes.
- Automation and Technology Integration: Could automation or technology integration improve the process efficiency and reduce errors? Outdated or inefficient processes can be improved with technological advancements.
- Control Measures and Quality Checks: Are there sufficient control measures and quality checks in place to prevent errors and ensure consistency? Insufficient quality control can lead to defects and inconsistencies.
Example: If customer complaints about long wait times are frequent, the "Methods" category might reveal inefficiencies in the customer service process, such as a lack of streamlined procedures or inadequate staff training.
Constructing an Effective Cause and Effect Diagram
Creating a comprehensive cause and effect diagram requires a structured approach:
-
Define the Problem: Clearly state the problem you are trying to solve. Be specific and measurable.
-
Draw the Main Bone: Draw a horizontal arrow pointing to the right, and write the problem statement at the head of the arrow.
-
Add the Four M Branches: Draw four main branches from the arrow, labeling them Manpower, Machines, Materials, and Methods.
-
Brainstorm Sub-Causes: With your team, brainstorm potential causes within each category. Use sub-branches to represent these sub-causes. Be thorough and don't limit yourselves.
-
Identify Root Causes: Analyze the sub-causes to identify the root causes of the problem. These are the fundamental issues driving the problem.
-
Verify and Validate: Review the diagram to ensure all significant causes have been considered. Validate the findings with data and evidence if possible.
-
Develop Solutions: Based on the identified root causes, develop solutions to address them effectively.
-
Implement and Monitor: Implement the solutions and monitor their effectiveness. Track the results to ensure that the problem has been resolved.
Beyond the Four Ms: Expanding Your Analysis
While the Four Ms provide a solid foundation, consider expanding your analysis to include other relevant factors, depending on the specific problem. These might include:
- Environment: This encompasses the surrounding conditions, such as temperature, humidity, and lighting.
- Measurement: This focuses on the accuracy and reliability of the measurement systems used.
- Management: This includes leadership styles, decision-making processes, and resource allocation.
- Money: This considers the financial aspects, such as budget constraints and cost-effectiveness.
Conclusion: Mastering the Four Ms for Effective Problem Solving
The Four Ms of cause and effect diagrams – Manpower, Machines, Materials, and Methods – provide a structured and comprehensive framework for identifying the root causes of problems. By systematically analyzing each category, teams can gain valuable insights into the contributing factors and develop effective solutions. Remember to utilize brainstorming techniques, involve a diverse group of individuals, and validate findings with data to ensure the accuracy and effectiveness of your analysis. Mastering the Four Ms empowers organizations to improve efficiency, enhance quality, and boost overall performance by proactively addressing issues and driving continuous improvement. Employing this methodology consistently fosters a culture of problem-solving and innovation within your organization.
Latest Posts
Latest Posts
-
A Continuing Process Of Identifying Collecting Analyzing
Mar 31, 2025
-
The Entire Principal Of An Interest Only Loan Is The
Mar 31, 2025
-
Multiple Sclerosis And Atherosclerosis Refer To
Mar 31, 2025
-
Linear Algebra And Its Applications 5th Edition
Mar 31, 2025
Related Post
Thank you for visiting our website which covers about The Four Ms Of Cause And Effect Diagrams Are . We hope the information provided has been useful to you. Feel free to contact us if you have any questions or need further assistance. See you next time and don't miss to bookmark.
