The Contribution Margin Ratio Is Interpreted As The Percent Of:
Holbox
Mar 25, 2025 · 7 min read
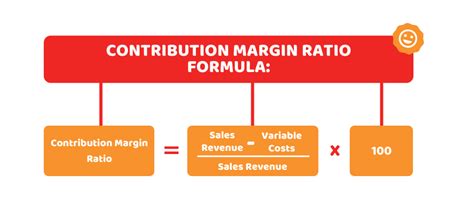
Table of Contents
- The Contribution Margin Ratio Is Interpreted As The Percent Of:
- Table of Contents
- The Contribution Margin Ratio: Interpreting the Percentage of Profitability
- Understanding the Contribution Margin Ratio
- Key Components of the Contribution Margin Ratio
- Calculating the Contribution Margin Ratio
- Interpreting the Contribution Margin Ratio
- Uses of the Contribution Margin Ratio
- Limitations of the Contribution Margin Ratio
- Improving the Contribution Margin Ratio
- Conclusion
- Latest Posts
- Latest Posts
- Related Post
The Contribution Margin Ratio: Interpreting the Percentage of Profitability
The contribution margin ratio is a crucial metric in managerial accounting that reveals the profitability of a company's products or services. Understanding this ratio is vital for businesses of all sizes, as it provides insights into pricing strategies, cost control, and overall financial health. This article will delve deep into the interpretation of the contribution margin ratio, exploring its components, calculation, uses, limitations, and how to improve it.
Understanding the Contribution Margin Ratio
The contribution margin ratio is interpreted as the percentage of each sales dollar that remains after covering variable costs. In simpler terms, it shows how much money is available from each sale to contribute towards covering fixed costs and generating profit. This ratio is expressed as a percentage and provides a valuable snapshot of a company's operational efficiency.
Key Components of the Contribution Margin Ratio
To fully grasp the contribution margin ratio, let's understand its constituent parts:
- Sales Revenue: This is the total amount of money generated from selling goods or services.
- Variable Costs: These are costs that directly change with the level of production or sales. Examples include direct materials, direct labor, and variable manufacturing overhead. Crucially, variable costs are directly proportional to sales volume. If sales double, so do variable costs.
- Contribution Margin: This is the difference between sales revenue and variable costs. It represents the amount available to cover fixed costs and generate profit. It can be expressed as a total amount or as a per-unit amount.
- Fixed Costs: These remain constant regardless of the production or sales volume. Examples include rent, salaries, depreciation, and insurance. Fixed costs are not directly proportional to sales volume. They stay the same even if sales fluctuate significantly.
Calculating the Contribution Margin Ratio
The formula for calculating the contribution margin ratio is straightforward:
(Sales Revenue - Variable Costs) / Sales Revenue * 100% = Contribution Margin Ratio
Alternatively, you can use this simpler formula which is derived from the one above:
(Contribution Margin) / Sales Revenue * 100% = Contribution Margin Ratio
Let's illustrate this with an example:
Imagine a company with sales revenue of $100,000 and variable costs of $60,000. The contribution margin would be $40,000 ($100,000 - $60,000). The contribution margin ratio would then be:
($40,000 / $100,000) * 100% = 40%
This means that 40% of each sales dollar is available to cover fixed costs and generate profit.
Interpreting the Contribution Margin Ratio
The interpretation of the contribution margin ratio depends heavily on the industry and the specific company's circumstances. However, some general interpretations apply:
-
High Contribution Margin Ratio (e.g., 70% or higher): This indicates that a significant portion of each sales dollar is available to contribute towards fixed costs and profit. This usually suggests a strong pricing strategy, efficient cost management of variable costs, or a combination of both. The company is in a favorable position to absorb increased fixed costs or generate higher profits.
-
Low Contribution Margin Ratio (e.g., 20% or lower): This suggests that a large portion of each sales dollar is consumed by variable costs, leaving little room for covering fixed costs and generating profit. This could signal issues with pricing, inefficient production processes, or high variable costs. The company may be vulnerable to changes in sales volume or increased fixed costs.
-
Comparison with Industry Benchmarks: It's crucial to compare the contribution margin ratio to industry averages or competitors. This provides a relative measure of performance and helps identify areas for improvement.
-
Trend Analysis: Monitoring the contribution margin ratio over time is vital. A declining trend might indicate emerging problems that need attention. This trend analysis gives early warning signals of potential financial issues.
Uses of the Contribution Margin Ratio
The contribution margin ratio has several practical applications in business decision-making:
-
Pricing Strategies: Understanding the contribution margin ratio helps businesses set appropriate prices that cover both variable and fixed costs and generate sufficient profit. By analyzing the ratio, companies can adjust their pricing strategies to maximize profitability.
-
Break-Even Analysis: The contribution margin ratio is crucial for calculating the break-even point – the sales level at which total revenue equals total costs (both fixed and variable). This information helps businesses plan for sales targets and determine the necessary sales volume to achieve profitability. The formula for break-even point in sales dollars is: Fixed Costs / Contribution Margin Ratio.
-
Sales Mix Decisions: When a company sells multiple products or services, the contribution margin ratio helps determine the optimal sales mix to maximize overall profitability. By analyzing the contribution margin ratio for each product, companies can prioritize those with higher ratios to improve overall profitability.
-
Cost Control: The ratio highlights areas where variable costs are high and need reduction. By closely examining the contribution margin ratio, management can identify areas for cost-cutting measures to improve efficiency and profitability. This requires a detailed analysis of each component of variable costs.
-
Performance Evaluation: The contribution margin ratio is a key performance indicator (KPI) used to evaluate the financial performance of a business unit or product line. Tracking this ratio over time provides insights into operational efficiency and helps identify areas for improvement.
-
Budgeting and Forecasting: The contribution margin ratio is useful in budgeting and forecasting, helping companies estimate the revenue needed to cover expenses and achieve their financial goals. It assists in developing realistic financial plans.
Limitations of the Contribution Margin Ratio
While the contribution margin ratio is a powerful tool, it has certain limitations:
-
Oversimplification: The ratio does not consider the complexities of all aspects of business operations. It primarily focuses on variable and fixed costs and sales revenue, neglecting other important financial elements.
-
Ignoring Time Value of Money: The ratio doesn't incorporate the time value of money, which means it doesn't account for the difference in value between money received today and money received in the future.
-
Impact of Fixed Costs: While the ratio considers fixed costs indirectly by showing how much revenue is available to cover them, it does not explicitly reflect the specific level of fixed costs. A business with high fixed costs will require a higher contribution margin ratio to achieve profitability than a business with low fixed costs.
-
Product Complexity: For businesses with complex products or services that involve multiple variable cost components, calculating the contribution margin ratio may be challenging. It can become complex to accurately allocate variable costs to each individual product, especially in diverse product portfolios.
-
Changes in the Business Environment: The contribution margin ratio does not automatically reflect changes in the business environment like economic downturns or increased competition. The context of external market forces must be considered alongside the ratio for more comprehensive analysis.
Improving the Contribution Margin Ratio
Several strategies can help improve the contribution margin ratio:
-
Increase Sales Prices: A strategic price increase, especially if demand is inelastic, can directly improve the contribution margin ratio. This will lead to a higher margin per unit.
-
Reduce Variable Costs: Streamlining production processes, negotiating better deals with suppliers, and improving efficiency can significantly reduce variable costs, thereby increasing the contribution margin ratio. This may involve investing in automation or improving waste management.
-
Increase Sales Volume: While not directly impacting the ratio itself, higher sales volume at a constant ratio generates a higher overall contribution margin which boosts profitability. This could be achieved through targeted marketing strategies or expanding into new markets.
-
Optimize Product Mix: Focus on higher-margin products to improve the overall contribution margin ratio. Businesses selling a range of products can shift their efforts to prioritize higher-margin items.
-
Invest in Technology: Using technology to automate processes, improve efficiency, and reduce errors can help reduce variable costs and boost the ratio. This could involve implementing new software solutions to better manage inventory or streamline production.
Conclusion
The contribution margin ratio is a powerful metric that offers valuable insights into a company's profitability and operational efficiency. Interpreting this percentage correctly requires understanding its components, calculation, uses, and limitations. By carefully analyzing the ratio, businesses can make informed decisions regarding pricing, cost control, and overall financial strategy. Regular monitoring of the ratio, coupled with a proactive approach to improving it, is essential for ensuring long-term financial health and success. Remember to always consider the ratio within the broader context of the company's industry, competitive landscape, and overall financial goals.
Latest Posts
Latest Posts
-
Which Of The Following Methods Can Be Used To Transmit
Mar 28, 2025
-
The Single Most Important Rule Of Water Safety Is
Mar 28, 2025
-
Classify Each Random Variable As Either Discrete Or Continuous
Mar 28, 2025
-
Atp Generally Energizes A Cellular Process By
Mar 28, 2025
-
Identify Popular Tools In Content Writing Domain
Mar 28, 2025
Related Post
Thank you for visiting our website which covers about The Contribution Margin Ratio Is Interpreted As The Percent Of: . We hope the information provided has been useful to you. Feel free to contact us if you have any questions or need further assistance. See you next time and don't miss to bookmark.
