Sketch The I-v Characteristics Of An Ideal Rectification Diode.
Holbox
Mar 26, 2025 · 6 min read
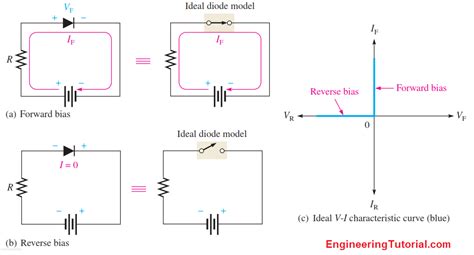
Table of Contents
- Sketch The I-v Characteristics Of An Ideal Rectification Diode.
- Table of Contents
- Sketching the I-V Characteristics of an Ideal Rectification Diode
- Understanding the Ideal Diode Model
- Sketching the I-V Characteristic Curve
- Comparing Ideal and Real Diodes: The Importance of the Forward Voltage Drop
- Sketching the I-V Characteristic of a Real Diode
- Applications and Importance of the Diode I-V Characteristic
- Conclusion: Bridging the Gap between Ideal and Real
- Latest Posts
- Latest Posts
- Related Post
Sketching the I-V Characteristics of an Ideal Rectification Diode
The humble diode, a seemingly simple semiconductor device, plays a crucial role in countless electronic circuits. Understanding its behavior, specifically its current-voltage (I-V) characteristics, is fundamental to circuit analysis and design. This article delves deep into sketching the I-V characteristics of an ideal rectification diode, highlighting key features and contrasting them with the behavior of real-world diodes.
Understanding the Ideal Diode Model
Before diving into the sketch, let's define what constitutes an ideal diode. The ideal diode model simplifies the diode's behavior, making analysis easier, particularly in introductory circuit theory. It adheres to two primary rules:
-
Zero Resistance in Forward Bias: When a positive voltage is applied across the diode (anode positive relative to cathode), it acts as a perfect conductor with zero resistance. Current flows freely without any voltage drop.
-
Infinite Resistance in Reverse Bias: When a negative voltage is applied (cathode positive relative to anode), it acts as an open circuit with infinite resistance. No current flows regardless of the applied voltage.
These simplified characteristics allow us to easily visualize and sketch its I-V curve.
Sketching the I-V Characteristic Curve
The I-V characteristic curve, also known as the I-V graph or diode curve, plots the diode current (I) against the applied voltage (V). For an ideal diode, this curve is remarkably simple:
-
The Horizontal Axis (x-axis): Represents the voltage (V) across the diode. Positive voltages indicate forward bias, while negative voltages indicate reverse bias.
-
The Vertical Axis (y-axis): Represents the current (I) flowing through the diode.
-
Forward Bias Region: In the forward bias region (V > 0), the ideal diode shows infinite current (I → ∞). This is represented by a vertical line extending upwards from the origin (0,0) along the positive voltage axis.
-
Reverse Bias Region: In the reverse bias region (V < 0), the ideal diode shows zero current (I = 0) regardless of the applied reverse voltage. This is represented by a horizontal line along the zero current axis (y=0) extending to the left.
                      I (Current)
                        ^
                        |
                        |      /-------\
                        |     /         \
                        |    /           \
                        |   /             \  Ideal Diode I-V Curve
       ∞----------------/------------------\
                        |                  |
                        |                  |
                        |                  |
                        |                  |
                        +------------------+---> V (Voltage)
                        0                  0
                         Reverse Bias      Forward Bias
The sharp transition at V=0 is a defining feature of the ideal diode. It perfectly switches between conducting and non-conducting states. There's no gradual increase in current with increasing forward voltage, as seen in real-world diodes.
Comparing Ideal and Real Diodes: The Importance of the Forward Voltage Drop
The ideal diode model is a simplification. Real diodes exhibit a more complex behavior. While they do approximate the ideal behavior in certain circumstances, key differences exist, particularly in the forward bias region.
-
Forward Voltage Drop: Real diodes require a minimum voltage, known as the forward voltage drop (typically 0.7V for silicon diodes and 0.3V for germanium diodes), before significant current starts to flow. Below this threshold, only a negligible current flows. This is absent in the ideal diode model.
-
Non-linear Current-Voltage Relationship: Once the forward voltage drop is exceeded, the current increases exponentially with voltage, not linearly as the ideal model suggests. This exponential relationship is governed by the diode equation:
I = I_s * (e^(V/(n*Vt)) - 1)Where:
Iis the diode currentI_sis the reverse saturation current (a very small current flowing in reverse bias)Vis the voltage across the diodenis the ideality factor (typically between 1 and 2)Vtis the thermal voltage (approximately 26mV at room temperature)
-
Reverse Saturation Current: Real diodes exhibit a small reverse saturation current,
I_s, even under reverse bias. While negligible compared to the forward current, it is not zero as in the ideal case. This current increases with temperature. -
Breakdown Voltage: At sufficiently high reverse voltages, real diodes can enter a breakdown region where a large reverse current flows. This is destructive if not carefully managed.
Sketching the I-V Characteristic of a Real Diode
The I-V curve for a real diode differs significantly from the ideal model, reflecting the factors mentioned above:
-
Reverse Bias Region: A small, but non-zero, reverse saturation current flows. This is represented by a very small negative current value along the negative voltage axis.
-
Threshold Voltage: A small current flows even in the forward bias region until the forward voltage drop is reached. This initial current remains very low.
-
Exponential Forward Bias Region: Once the threshold voltage is surpassed, the current rises exponentially with voltage. The curve is not a vertical line but a sharp curve upward.
-
Breakdown Region (Not always shown): At very high reverse voltages, the curve will show a sharp increase in current in the reverse direction, signifying breakdown.
                      I (Current)
                        ^
                        |
                        |       /---------------------\
                        |      /                       \
                        |     /                         \
                        |    /                           \ Real Diode I-V Curve
                        |   /                             \
                        |  /                               \
                        | /                                 \
       I_s-------------/-----------------------------------\------- Breakdown
                        |                                      |
                        |                                      |
                        |                                      |
                        +-------------------------------------+---> V (Voltage)
                        0                                      0
                         Reverse Bias                      Forward Bias
Applications and Importance of the Diode I-V Characteristic
Understanding the I-V characteristic, both ideal and real, is crucial for various applications:
-
Rectification: Diodes are essential components in rectifiers, converting alternating current (AC) to direct current (DC). The ideal model helps in basic rectifier analysis, while the real diode model provides a more accurate prediction of output voltage and ripple.
-
Clipping and Clamping: Diodes are used for clipping and clamping circuits that limit or shift voltage levels. The I-V characteristics define the clipping and clamping levels.
-
Switching: In switching circuits, the diode's fast switching action between on and off states is crucial. The I-V curve helps analyze the switching speed and losses.
-
Voltage Regulation: Zener diodes, a special type of diode, utilize their breakdown region in reverse bias for voltage regulation. Their I-V curve is characterized by a nearly constant voltage drop across the breakdown region.
-
Signal Processing: Diodes can be used in various signal processing applications, shaping and altering waveforms based on their unique nonlinear I-V characteristic.
Conclusion: Bridging the Gap between Ideal and Real
While the ideal diode model simplifies circuit analysis, it is essential to remember its limitations. Understanding the differences between the ideal and real diode I-V characteristics is paramount for accurate circuit design and analysis. The exponential nature of current flow in real diodes and the existence of forward voltage drop and reverse saturation current must be considered for realistic simulations and performance predictions. Mastering these concepts paves the way for a deeper understanding of electronics and its wide range of applications. Remember that while the ideal diode serves as a helpful starting point, real-world circuit design relies on incorporating the more nuanced behaviors observed in real diodes.
Latest Posts
Latest Posts
-
Suppose Smith Pays 100 To Jones
Mar 30, 2025
-
Workers Act As Sellers Of Their Time
Mar 30, 2025
-
Why Is Retaliation By Government Intervention A Risky Strategy
Mar 30, 2025
-
How Many Numbers Are Between 1 And 4
Mar 30, 2025
-
The Main Cause Of Melting Along Subduction Zones Is The
Mar 30, 2025
Related Post
Thank you for visiting our website which covers about Sketch The I-v Characteristics Of An Ideal Rectification Diode. . We hope the information provided has been useful to you. Feel free to contact us if you have any questions or need further assistance. See you next time and don't miss to bookmark.
