Sketch A Qualitative Energy Diagram For The Dissolution Of Lii
Holbox
Mar 28, 2025 · 7 min read
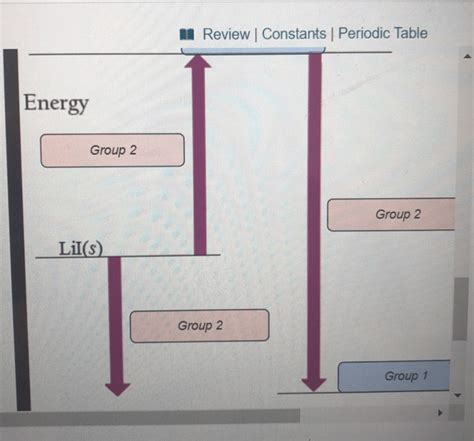
Table of Contents
- Sketch A Qualitative Energy Diagram For The Dissolution Of Lii
- Table of Contents
- Sketching a Qualitative Energy Diagram for the Dissolution of LiI
- Understanding the Components of Dissolution
- 1. Lattice Energy (ΔH<sub>lattice</sub>)
- 2. Hydration Enthalpy (ΔH<sub>hydration</sub>)
- 3. Enthalpy of Solution (ΔH<sub>solution</sub>)
- Sketching the Qualitative Energy Diagram
- Analyzing the Diagram and Predicting the Outcome
- Factors Influencing the Enthalpy of Solution
- Expanding on the Qualitative Analysis: A More Detailed Diagram
- Conclusion
- Latest Posts
- Latest Posts
- Related Post
Sketching a Qualitative Energy Diagram for the Dissolution of LiI
Dissolving lithium iodide (LiI) in water is a seemingly simple process, but understanding the underlying energetics requires a detailed look at the various interactions involved. This article will guide you through sketching a qualitative energy diagram for this dissolution process, explaining the contributing factors and their relative magnitudes. We'll explore the concepts of lattice energy, hydration enthalpy, and the overall enthalpy of solution, illustrating how these components combine to determine whether the dissolution is exothermic or endothermic. This detailed exploration will enhance your understanding of solution thermodynamics and equip you with the skills to analyze similar processes.
Understanding the Components of Dissolution
Before we delve into the energy diagram, let's establish a firm grasp of the key energetic components involved in the dissolution of LiI:
1. Lattice Energy (ΔH<sub>lattice</sub>)
This represents the energy required to completely separate one mole of a solid ionic compound into its gaseous ions. For LiI, this involves breaking the strong electrostatic attractions between Li<sup>+</sup> and I<sup>-</sup> ions in the crystalline lattice. Because strong ionic bonds are being broken, lattice energy is always positive (endothermic). The magnitude of the lattice energy is significantly influenced by the charges of the ions and the distance between them—higher charges and shorter distances lead to stronger attractions and higher lattice energy.
2. Hydration Enthalpy (ΔH<sub>hydration</sub>)
This is the energy change when gaseous ions are surrounded by water molecules. Water molecules are polar, possessing a partial positive charge on the hydrogen atoms and a partial negative charge on the oxygen atom. These polar water molecules interact strongly with the Li<sup>+</sup> and I<sup>-</sup> ions through ion-dipole interactions. The negatively charged oxygen atoms of water molecules are attracted to the positively charged Li<sup>+</sup> ions, while the positively charged hydrogen atoms are attracted to the negatively charged I<sup>-</sup> ions. This interaction releases energy, making hydration enthalpy typically negative (exothermic). The magnitude of hydration enthalpy depends on the charge density of the ions; higher charge density leads to stronger ion-dipole interactions and a more negative hydration enthalpy. Smaller ions generally have higher charge densities and therefore stronger hydration.
3. Enthalpy of Solution (ΔH<sub>solution</sub>)
This is the overall energy change when one mole of a solute dissolves in a solvent. It's the sum of the lattice energy and the hydration enthalpy:
ΔH<sub>solution</sub> = ΔH<sub>hydration</sub> + ΔH<sub>lattice</sub>
If ΔH<sub>solution</sub> is negative, the dissolution process is exothermic (heat is released), while a positive ΔH<sub>solution</sub> indicates an endothermic process (heat is absorbed).
Sketching the Qualitative Energy Diagram
Now, let's construct the qualitative energy diagram for the dissolution of LiI. The diagram will illustrate the relative energy changes associated with each step:
-
Initial State: Begin with LiI(s) at a defined energy level. This represents the solid LiI in its crystalline state.
-
Lattice Energy (ΔH<sub>lattice</sub>): Draw an upward arrow representing the energy required to break the ionic bonds in the LiI lattice. This is a large positive value, indicating an endothermic process. The arrow should be significantly long to reflect the considerable energy involved in overcoming strong ionic interactions.
-
Gaseous Ions: Show the energy level of the gaseous Li<sup>+</sup>(g) and I<sup>-</sup>(g) ions. This level is higher than the initial state because energy was absorbed to break the lattice.
-
Hydration Enthalpy (ΔH<sub>hydration</sub>): Draw a downward arrow from the gaseous ions level, representing the energy released during hydration. This is a negative value (exothermic). While hydration of I<sup>-</sup> releases a significant amount of energy, the smaller Li<sup>+</sup> ion, with its higher charge density, experiences a considerably stronger interaction with water molecules. Thus, the downward arrow should be notably long, reflecting a highly exothermic process for Li<sup>+</sup> hydration.
-
Final State: The final energy level represents the Li<sup>+</sup>(aq) and I<sup>-</sup>(aq) ions dissolved in water. This level will be lower than the initial state, if the process is overall exothermic (which is expected for LiI).
Analyzing the Diagram and Predicting the Outcome
The length of the arrows in the diagram visually represents the magnitude of the energy changes. Because the hydration enthalpy (exothermic) is generally larger in magnitude than the lattice energy (endothermic) for LiI, the final energy level of the dissolved ions is lower than the initial energy level of solid LiI. This indicates that the overall dissolution process of LiI in water is exothermic (ΔH<sub>solution</sub> < 0). Heat is released into the surroundings as the ions become hydrated.
However, it's crucial to note that this is a qualitative diagram. Precise energy values aren't depicted; the focus is on the relative magnitudes and the overall direction of the energy change. Accurate quantitative values would require thermodynamic data for LiI, obtained experimentally or through computational methods.
Factors Influencing the Enthalpy of Solution
Several factors beyond the basic lattice energy and hydration enthalpy can influence the enthalpy of solution:
-
Temperature: The enthalpy of solution can vary with temperature.
-
Solvent Properties: The nature of the solvent significantly impacts the strength of ion-solvent interactions. Polar solvents, like water, are effective in dissolving ionic compounds, while nonpolar solvents are not.
-
Ion Size and Charge: As previously mentioned, smaller ions with higher charge densities experience stronger hydration, leading to a more negative hydration enthalpy.
-
Solvent-Solvent Interactions: Breaking the existing interactions between solvent molecules (water-water interactions in this case) also requires energy. This contributes a smaller positive term to the overall energy change.
-
Ion-Pair Formation: In some cases, dissolved ions may interact with each other to form ion pairs, which can affect the overall enthalpy of solution. This is less likely to be significant in the case of LiI due to the strong hydration of the ions.
Expanding on the Qualitative Analysis: A More Detailed Diagram
To further refine our qualitative understanding, we can consider a more detailed diagram that separates hydration enthalpy into the individual contributions from Li<sup>+</sup> and I<sup>-</sup> ions:
-
Initial State: LiI(s)
-
Lattice Energy: Upward arrow to represent the endothermic breaking of the LiI lattice.
-
Gaseous Ions: Li<sup>+</sup>(g) and I<sup>-</sup>(g)
-
Li<sup>+</sup> Hydration: Downward arrow to represent the strongly exothermic hydration of Li<sup>+</sup>. This arrow should be longer than the one representing I<sup>-</sup> hydration, reflecting the stronger interaction due to the smaller size and higher charge density of Li<sup>+</sup>.
-
I<sup>-</sup> Hydration: Downward arrow to represent the exothermic hydration of I<sup>-</sup>. This arrow should be shorter than the Li<sup>+</sup> hydration arrow.
-
Final State: Li<sup>+</sup>(aq) and I<sup>-</sup>(aq) in solution. This is below the starting energy level reflecting the overall exothermic nature.
This more detailed diagram emphasizes the dominant role of Li<sup>+</sup> ion hydration in the overall exothermicity of the process.
Conclusion
Sketching a qualitative energy diagram provides a valuable visual representation of the energetics of dissolution. For LiI, the diagram clearly shows that the large, exothermic hydration enthalpy of the ions, particularly Li<sup>+</sup>, overcomes the endothermic lattice energy, resulting in an overall exothermic dissolution process. This analysis highlights the interplay of various energetic factors that govern the solubility of ionic compounds in water. Understanding these principles allows for a more nuanced understanding of solution chemistry and its applications. By carefully considering the relative magnitudes of these energy changes, one can predict the overall enthalpy of solution and gain insights into the thermodynamic driving forces behind the dissolution process. Remember, although this is a qualitative sketch, it serves as a powerful tool for understanding the complex energy landscape of this simple-looking process.
Latest Posts
Latest Posts
-
Solutions Electrolytes And Concentration Report Sheet
Apr 01, 2025
-
Carter Is Helping His Supervising Attorney
Apr 01, 2025
-
Select The True Statements About The Electron Transport Chain
Apr 01, 2025
-
The Speed Of Light In A Vacuum Is
Apr 01, 2025
-
Your Science Teacher Sets Up Six Flasks
Apr 01, 2025
Related Post
Thank you for visiting our website which covers about Sketch A Qualitative Energy Diagram For The Dissolution Of Lii . We hope the information provided has been useful to you. Feel free to contact us if you have any questions or need further assistance. See you next time and don't miss to bookmark.
