Process Capability Compares Process Variability To The Tolerances.
Holbox
Mar 28, 2025 · 7 min read
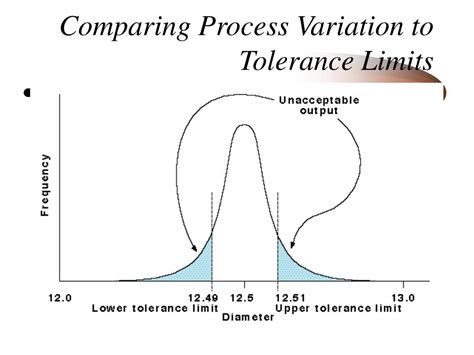
Table of Contents
- Process Capability Compares Process Variability To The Tolerances.
- Table of Contents
- Process Capability: Comparing Process Variability to Tolerances
- Understanding Process Variability
- Measuring Process Variability
- Understanding Tolerances
- The Relationship between Process Variability and Tolerances
- Process Capability Indices (Cp, Cpk, Pp, Ppk)
- Cp (Process Capability Index)
- Cpk (Process Capability Index)
- Pp and Ppk (Process Performance Indices)
- Interpreting Process Capability Indices
- Applications of Process Capability Analysis
- Improving Process Capability
- Limitations of Process Capability Analysis
- Conclusion
- Latest Posts
- Latest Posts
- Related Post
Process Capability: Comparing Process Variability to Tolerances
Process capability analysis is a crucial statistical method used to determine whether a process is capable of consistently producing outputs that meet predefined specifications or tolerances. It's a critical tool for quality control, allowing manufacturers and service providers to assess the performance of their processes and identify areas for improvement. This comprehensive guide will delve into the intricacies of process capability, explaining how it compares process variability to tolerances, and providing insights into its practical applications.
Understanding Process Variability
Before diving into process capability, it's crucial to understand the concept of process variability. Variability refers to the natural fluctuations inherent in any process. No two outputs will ever be precisely identical, even under seemingly identical conditions. This variability can stem from various sources, including:
-
Common Cause Variation: This is inherent to the process itself and is typically small and random. It's often considered background noise and is difficult to eliminate entirely. Think of minor fluctuations in temperature, slight variations in material properties, or the natural inconsistencies in human actions.
-
Special Cause Variation: This is attributable to identifiable sources, such as machine malfunction, operator error, faulty materials, or changes in the process parameters. These are often larger variations and should be investigated and corrected to improve process stability.
Understanding and quantifying this variability is paramount to assessing process capability. Statistical tools like control charts are frequently used to identify and differentiate between common and special cause variation.
Measuring Process Variability
Process variability is often quantified using statistical measures such as:
-
Standard Deviation (σ): This measures the spread or dispersion of the data around the mean. A larger standard deviation indicates greater variability.
-
Range (R): This is the difference between the maximum and minimum values in a dataset. It's a simpler measure of variability but less precise than the standard deviation.
-
Variance (σ²): The square of the standard deviation. It's less intuitively understood than the standard deviation but plays a crucial role in statistical calculations.
Understanding Tolerances
Tolerances define the acceptable range of variation for a product characteristic. They are predetermined limits set by designers or engineers, specifying the allowable deviation from the target value. If a product's characteristic falls outside these tolerances, it's considered defective or non-conforming.
Tolerances are crucial for ensuring product quality and functionality. They are often expressed as:
-
Upper Specification Limit (USL): The maximum acceptable value for a characteristic.
-
Lower Specification Limit (LSL): The minimum acceptable value for a characteristic.
-
Nominal Value (Target Value): The ideal or desired value for a characteristic.
The difference between the USL and LSL defines the total tolerance width. A smaller tolerance width indicates tighter specifications and higher quality requirements.
The Relationship between Process Variability and Tolerances
Process capability analysis directly compares the inherent variability of a process to the predefined tolerances. The goal is to determine if the process variability is small enough to consistently produce outputs within the specified tolerances. If the process variability is significantly larger than the tolerance, the process is considered incapable and will produce a high proportion of defective products.
Process Capability Indices (Cp, Cpk, Pp, Ppk)
Process capability is usually expressed using various indices, the most common being Cp, Cpk, Pp, and Ppk. These indices provide a quantitative measure of process capability, allowing for objective comparisons and decision-making.
Cp (Process Capability Index)
Cp measures the potential capability of a process, assuming the process is centered on the target value. It compares the process spread (typically 6σ) to the tolerance width:
Cp = (USL - LSL) / 6σ
A Cp value greater than 1 indicates that the process is potentially capable; however, it doesn't account for process centering. A Cp of 1.33 or higher is often considered acceptable.
Cpk (Process Capability Index)
Cpk considers both the process spread and its centering relative to the target value. It's a more realistic and comprehensive measure of process capability. It's the minimum of the two following calculations:
Cpk = min [(USL - μ) / 3σ, (μ - LSL) / 3σ]
Where μ is the process mean. A Cpk value greater than 1 signifies that the process is capable, while values below 1 suggest the process is producing a significant number of defects. Similar to Cp, a Cpk value of 1.33 or higher is typically considered acceptable.
Pp and Ppk (Process Performance Indices)
Pp and Ppk are similar to Cp and Cpk, but they use the actual process data range instead of the assumed 6σ. This means they reflect the actual performance of the process over a specific period, rather than its potential capability. They are useful for evaluating historical process performance.
-
Pp = (USL - LSL) / 6R (where R is the range of the data)
-
Ppk = min [(USL - μ) / 3R, (μ - LSL) / 3R] (where R is the range of the data)
Using both capability and performance indices offers a holistic understanding of process performance.
Interpreting Process Capability Indices
The interpretation of process capability indices is crucial for effective decision-making. Here's a general guideline:
-
Cpk/Cp < 1: The process is incapable; significant improvement is needed. A large proportion of defective products are expected.
-
1 ≤ Cpk/Cp < 1.33: The process is marginally capable; improvements are recommended. The defect rate might be acceptable, but there's room for improvement to reduce variability.
-
1.33 ≤ Cpk/Cp < 1.67: The process is capable; it's generally considered acceptable. The defect rate is low.
-
Cpk/Cp ≥ 1.67: The process is highly capable; it's performing exceptionally well. The defect rate is very low.
Applications of Process Capability Analysis
Process capability analysis is a versatile tool applicable across various industries and processes. Some key applications include:
-
Manufacturing: Assessing the capability of production processes to meet product specifications, ensuring quality and minimizing waste.
-
Service Industries: Evaluating the efficiency and consistency of service delivery processes, such as call center response times or order fulfillment.
-
Healthcare: Assessing the reliability and precision of medical equipment and procedures.
-
Software Development: Measuring the reliability and stability of software processes.
-
Finance: Assessing the accuracy and efficiency of financial processes, such as transaction processing or risk management.
Improving Process Capability
When a process is found to be incapable, several strategies can be employed to improve its capability:
-
Identify and Eliminate Special Cause Variation: Investigate and address sources of special cause variation using tools like control charts and root cause analysis.
-
Reduce Common Cause Variation: Implement process improvements to reduce the inherent variability in the process. This might involve improving equipment, training operators, or optimizing process parameters.
-
Center the Process: Adjust the process mean to be closer to the target value. This can significantly improve Cpk, even if the variability remains the same.
-
Tighten Tolerances: In some cases, it might be possible to relax the tolerances. However, this should be done carefully and only if it doesn't compromise product functionality or quality.
Limitations of Process Capability Analysis
While process capability analysis is a powerful tool, it has certain limitations:
-
Assumes Normality: Many capability indices assume the data follows a normal distribution. If the data is significantly non-normal, the results might be misleading. Transformations or non-parametric methods might be necessary.
-
Focus on Single Characteristics: Process capability typically analyzes single characteristics at a time. It might not capture the overall process capability when multiple characteristics are critical.
-
Doesn't Account for All Sources of Variation: While it accounts for variability, it might not fully capture all sources of variation, such as those due to interactions between different process steps.
-
Data Requirements: Sufficient, representative data is required for reliable analysis. Insufficient data can lead to inaccurate conclusions.
Conclusion
Process capability analysis is a powerful statistical tool for assessing the ability of a process to meet predefined specifications. By comparing process variability to tolerances, it provides a quantitative measure of process capability, enabling manufacturers and service providers to make informed decisions about process improvement and quality control. Understanding the various indices (Cp, Cpk, Pp, Ppk), their interpretations, and the limitations of the analysis is crucial for effective implementation and interpretation. By utilizing this methodology, businesses can minimize defects, enhance product quality, and achieve greater operational efficiency. Remember that continuous monitoring and improvement are essential for maintaining high process capability over time.
Latest Posts
Latest Posts
-
The Cost Of Land Does Not Include
Apr 01, 2025
-
The Term Xenophobia Can Best Be Defined As
Apr 01, 2025
-
Which Of The Following Is Not A Fixed Cost
Apr 01, 2025
-
Denormalization Never Results In Second Normal Form Tables
Apr 01, 2025
-
Economics Is The Study Of Producing And Goods And Services
Apr 01, 2025
Related Post
Thank you for visiting our website which covers about Process Capability Compares Process Variability To The Tolerances. . We hope the information provided has been useful to you. Feel free to contact us if you have any questions or need further assistance. See you next time and don't miss to bookmark.
