In The Confidence Interval The Quantity Is Called The
Holbox
Mar 21, 2025 · 6 min read
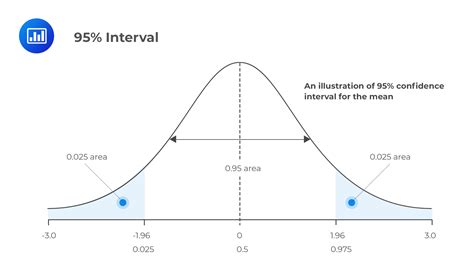
Table of Contents
In the Confidence Interval, the Quantity is Called the Margin of Error
Understanding confidence intervals is crucial for anyone working with statistical data. They provide a range of values within which we can be reasonably certain the true population parameter lies. A key component of this range is the margin of error. This article will delve deep into the margin of error, explaining its meaning, calculation, interpretation, and influence on the width of the confidence interval. We'll explore different scenarios and consider the impact of sample size and confidence level on the margin of error. Let's unravel the mysteries of this vital statistical concept.
What is a Confidence Interval?
Before diving into the margin of error, let's solidify our understanding of confidence intervals. A confidence interval provides a range of plausible values for a population parameter, such as the population mean or proportion. Instead of providing a single point estimate, which may be subject to sampling error, a confidence interval acknowledges the inherent uncertainty in estimations based on a sample.
For instance, if we're trying to estimate the average height of adult women in a country, we wouldn't realistically measure every single woman. Instead, we'd take a random sample and calculate the average height from that sample. The confidence interval would then provide a range of values, say 5'4" to 5'6", within which we are, for example, 95% confident that the true average height of all adult women in the country lies.
This "95% confident" statement refers to the confidence level. It represents the percentage of times that the confidence interval, if constructed repeatedly from different samples, would contain the true population parameter. A higher confidence level leads to a wider interval, while a lower confidence level leads to a narrower interval.
Understanding the Margin of Error
The margin of error is the plus or minus value added to and subtracted from the point estimate to create the confidence interval. It quantifies the uncertainty associated with the point estimate. A smaller margin of error indicates a more precise estimate, while a larger margin of error indicates more uncertainty.
Think of it this way: The point estimate is your best guess, and the margin of error represents the potential error in that guess. The confidence interval encompasses the range of values that are plausible given the observed data and the inherent uncertainty.
Mathematically, the confidence interval is represented as:
Point Estimate ± Margin of Error
Calculating the Margin of Error
The calculation of the margin of error depends on several factors:
-
Confidence Level: As mentioned earlier, a higher confidence level requires a larger margin of error. This is because to be more confident, we need a wider interval to encompass the true population parameter. Common confidence levels are 90%, 95%, and 99%. Each confidence level corresponds to a specific critical value (z-score or t-score, depending on whether the population standard deviation is known).
-
Standard Error: The standard error measures the variability of the sample statistic (e.g., the sample mean) across different samples. It's a measure of how much the sample statistic is likely to vary from the true population parameter. A smaller standard error indicates less variability and thus a smaller margin of error. The standard error is calculated as:
-
For the mean: Standard Deviation / √(Sample Size)
-
For the proportion: √[p(1-p) / n] where 'p' is the sample proportion and 'n' is the sample size.
-
-
Sample Size: A larger sample size reduces the standard error and thus leads to a smaller margin of error. Larger samples provide more information about the population, resulting in more precise estimates.
-
Population Standard Deviation (σ): If known, the population standard deviation is used in calculating the standard error. If unknown (which is more common), the sample standard deviation (s) is used as an estimate, resulting in a t-distribution rather than a z-distribution.
Formula for Margin of Error (using z-score, for large samples or known population standard deviation):
Margin of Error = z * (Standard Error)
where 'z' is the z-score corresponding to the desired confidence level. For example:
- 90% confidence level: z ≈ 1.645
- 95% confidence level: z ≈ 1.96
- 99% confidence level: z ≈ 2.576
Formula for Margin of Error (using t-score, for small samples and unknown population standard deviation):
Margin of Error = t * (Standard Error)
where 't' is the t-score corresponding to the desired confidence level and degrees of freedom (n-1, where n is the sample size). A t-table or statistical software is used to find the appropriate t-score.
Interpretation of the Margin of Error
The margin of error is not just a number; it's a crucial piece of information that helps us interpret the confidence interval. Let's illustrate with an example:
Suppose we conduct a survey of 1000 voters and find that 55% support a particular candidate. With a 95% confidence level, the margin of error might be calculated as ±3%. This means:
- Our point estimate is 55%.
- The 95% confidence interval is 52% to 58%.
- We are 95% confident that the true proportion of voters supporting the candidate lies between 52% and 58%.
- The margin of error of ±3% reflects the uncertainty inherent in our estimate based on a sample of 1000 voters. If we had a larger sample, the margin of error would likely be smaller.
The Influence of Sample Size and Confidence Level
The sample size and confidence level significantly impact the margin of error. Let's examine their influence:
Sample Size:
- Direct Relationship with Standard Error: As the sample size increases, the standard error decreases. This is because larger samples provide more precise estimates.
- Inverse Relationship with Margin of Error: As the standard error decreases, the margin of error also decreases. This means that larger samples lead to smaller margins of error, resulting in narrower confidence intervals and more precise estimates.
Confidence Level:
- Direct Relationship with z-score (or t-score): As the confidence level increases, the corresponding z-score (or t-score) increases. This is because a higher confidence level requires a wider interval to be more certain of capturing the true population parameter.
- Direct Relationship with Margin of Error: Since the z-score (or t-score) is directly proportional to the margin of error, increasing the confidence level results in a larger margin of error and a wider confidence interval.
Practical Implications and Considerations
Understanding the margin of error is critical in many applications, including:
- Market Research: Assessing the accuracy of survey results.
- Public Opinion Polls: Interpreting the uncertainty associated with poll findings.
- Medical Research: Determining the reliability of clinical trial results.
- Quality Control: Evaluating the variability of product characteristics.
It's crucial to remember that the margin of error only accounts for sampling variability. It doesn't account for other potential sources of error, such as non-response bias, measurement error, or sampling bias. Therefore, the margin of error should be interpreted carefully within the context of the study design and potential limitations.
Conclusion
The margin of error is a fundamental concept in statistical inference. It quantifies the uncertainty associated with estimates based on sample data. By understanding its calculation, interpretation, and influence on the width of the confidence interval, we can better assess the reliability and precision of statistical findings across various fields. Remember that larger sample sizes and lower confidence levels lead to smaller margins of error, resulting in narrower and potentially more informative confidence intervals. However, always consider potential non-sampling errors that might affect the overall accuracy of the results. Using this knowledge effectively enables informed decision-making based on statistical evidence.
Latest Posts
Latest Posts
-
A Price Setter Company Will Use More
Mar 22, 2025
-
A Major Purpose Of Cost Accounting Is To
Mar 22, 2025
-
Fetal And Neonatal Pharmacology For The Advanced Practice Nurse
Mar 22, 2025
-
When Must Emergency Preparedness Drills Be Conducted
Mar 22, 2025
-
A Business Message Is Complete If It
Mar 22, 2025
Related Post
Thank you for visiting our website which covers about In The Confidence Interval The Quantity Is Called The . We hope the information provided has been useful to you. Feel free to contact us if you have any questions or need further assistance. See you next time and don't miss to bookmark.
