How To Calculate A Cumulative Percentage
Holbox
Mar 10, 2025 · 5 min read
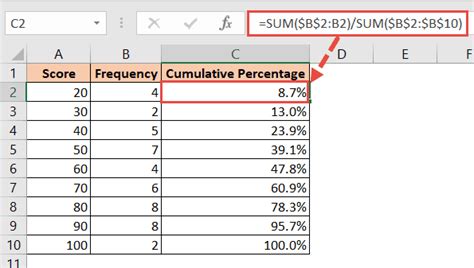
Table of Contents
How to Calculate a Cumulative Percentage: A Comprehensive Guide
Calculating cumulative percentages is a crucial skill in various fields, from analyzing sales data and understanding financial trends to evaluating academic progress and monitoring project milestones. This comprehensive guide will walk you through the process, covering different methods and providing practical examples to solidify your understanding. Whether you're a student, a business professional, or simply someone curious about data analysis, this guide will empower you to confidently calculate and interpret cumulative percentages.
Understanding Cumulative Percentages
Before diving into the calculations, let's clarify what a cumulative percentage represents. It's the running total of percentages as you move through a dataset. Essentially, it shows the accumulated percentage up to a specific point in the data sequence. Unlike simple percentages that represent the proportion of a single value to the total, cumulative percentages illustrate the accumulation of proportions over time or across categories.
Methods for Calculating Cumulative Percentages
There are several ways to calculate cumulative percentages, depending on the type of data and the tools available. We will explore the most common methods:
Method 1: Manual Calculation using a Spreadsheet or Calculator
This method is suitable for smaller datasets and involves a step-by-step calculation.
Steps:
-
Calculate Individual Percentages: First, calculate the percentage of each individual value relative to the total. The formula is:
(Individual Value / Total Sum) * 100. -
Calculate Cumulative Percentages: Start with the first individual percentage. This will be your first cumulative percentage. For subsequent values, add the current individual percentage to the previous cumulative percentage. This gives you the running total.
Example:
Let's say we have the following sales data for four months:
| Month | Sales |
|---|---|
| January | 100 |
| February | 150 |
| March | 200 |
| April | 250 |
Total Sales: 100 + 150 + 200 + 250 = 700
-
Individual Percentages:
- January: (100 / 700) * 100 = 14.29%
- February: (150 / 700) * 100 = 21.43%
- March: (200 / 700) * 100 = 28.57%
- April: (250 / 700) * 100 = 35.71%
-
Cumulative Percentages:
- January: 14.29%
- February: 14.29% + 21.43% = 35.72%
- March: 35.72% + 28.57% = 64.29%
- April: 64.29% + 35.71% = 100% (or very close due to rounding)
The final table would look like this:
| Month | Sales | Individual Percentage | Cumulative Percentage |
|---|---|---|---|
| January | 100 | 14.29% | 14.29% |
| February | 150 | 21.43% | 35.72% |
| March | 200 | 28.57% | 64.29% |
| April | 250 | 35.71% | 100% |
Method 2: Using Spreadsheet Software (Excel, Google Sheets)
Spreadsheet software significantly simplifies the calculation of cumulative percentages, especially for large datasets.
Steps:
-
Enter Your Data: Input your data into columns. Let's assume your values are in column A.
-
Calculate Individual Percentages: In column B, use the formula
=(A1/SUM(A:A))*100in the first row (B1) and drag it down to apply it to all rows. -
Calculate Cumulative Percentages: In column C, use the formula
=SUM($B$1:B1)in the first row (C1) and drag it down. The$signs fix the reference to cell B1, ensuring that the sum always starts from the top.
This automatically calculates the cumulative percentage for each row.
Method 3: Using Programming Languages (Python, R)
For larger and more complex datasets, programming languages like Python or R offer efficient ways to calculate cumulative percentages. These languages provide powerful libraries for data manipulation and analysis.
Python Example:
import pandas as pd

data = {'Values': [100, 150, 200, 250]}
df = pd.DataFrame(data)
df['Percentage'] = (df['Values'] / df['Values'].sum()) * 100
df['Cumulative Percentage'] = df['Percentage'].cumsum()
print(df)
This code utilizes the pandas library, a powerful tool for data manipulation and analysis in Python. It efficiently calculates both individual and cumulative percentages. Similar approaches exist in R using libraries like dplyr.
Applications of Cumulative Percentages
Cumulative percentages find broad applications across numerous fields:
-
Financial Analysis: Tracking the growth of investments, analyzing revenue streams over time, and monitoring expenses.
-
Sales and Marketing: Evaluating sales performance, measuring campaign effectiveness, and analyzing customer acquisition.
-
Project Management: Monitoring project progress, assessing task completion, and identifying potential delays.
-
Academic Performance: Tracking student grades throughout a semester or academic year, providing a clear overview of their academic progress.
-
Quality Control: Monitoring defect rates, evaluating process improvements, and identifying areas needing attention.
-
Healthcare: Tracking patient progress, analyzing treatment outcomes, and monitoring disease prevalence.
Interpreting Cumulative Percentages
Interpreting cumulative percentages requires understanding the context of the data. For example:
-
A high cumulative percentage at an early stage could indicate strong initial performance or rapid growth.
-
A low cumulative percentage at a later stage might signal lagging progress or underperformance.
-
Analyzing the rate of change in cumulative percentages can reveal trends, such as acceleration or deceleration of growth.
Always consider the overall trend and context of the data when interpreting cumulative percentages, not just isolated values.
Common Mistakes to Avoid
-
Incorrect Calculation of Individual Percentages: Ensure the individual percentages are accurately calculated before moving to cumulative percentages.
-
Failing to Use Absolute Cell Referencing: When using spreadsheet software, always use absolute cell referencing (
$) to ensure the correct values are summed. -
Misinterpreting the Results: Context is key. Do not interpret cumulative percentages in isolation; consider the entire dataset and the trends.
-
Ignoring Data Quality: Ensure the underlying data is accurate and reliable before attempting any calculations.
Conclusion
Calculating cumulative percentages is a valuable skill with wide-ranging applications. This guide provides a thorough understanding of different methods for calculating cumulative percentages, ranging from manual calculations to using spreadsheet software and programming languages. Remember that accurate calculations and insightful interpretation are crucial for extracting meaningful insights from your data. By mastering this skill, you will significantly enhance your data analysis capabilities and gain a deeper understanding of trends and patterns within your data. This will empower you to make more informed decisions and contribute effectively to various projects and analyses.
Latest Posts
Latest Posts
-
Low Is Too High As Easy Is To
Mar 10, 2025
-
If Is A Linear Transformation Such That And Then
Mar 10, 2025
-
Molar Latent Heat Of The Transformation Caf2
Mar 10, 2025
-
When Approaching A Merging Traffic Sign You Should
Mar 10, 2025
-
You Ve Just Calibrated Your Thermometer Using Ice Water
Mar 10, 2025
Related Post
Thank you for visiting our website which covers about How To Calculate A Cumulative Percentage . We hope the information provided has been useful to you. Feel free to contact us if you have any questions or need further assistance. See you next time and don't miss to bookmark.
