How Do You Calculate Expected Frequency
Holbox
Mar 10, 2025 · 5 min read
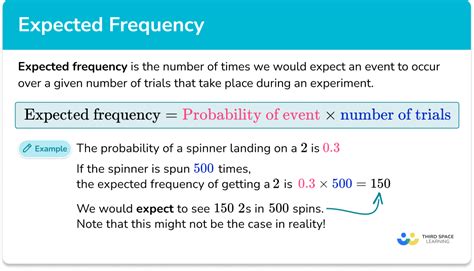
Table of Contents
How Do You Calculate Expected Frequency? A Comprehensive Guide
Expected frequency, a cornerstone concept in statistical analysis, represents the anticipated number of times a specific event is likely to occur given certain conditions. Understanding how to calculate expected frequency is crucial across various disciplines, from hypothesis testing and chi-square analysis to probability modeling and forecasting. This comprehensive guide will delve deep into the calculation methods, practical applications, and potential pitfalls to ensure a thorough understanding of this vital statistical tool.
What is Expected Frequency?
Before diving into the calculations, let's establish a clear definition. Expected frequency refers to the predicted or theoretical frequency of an event based on a probability model or a null hypothesis. It's not the actual observed frequency (what you counted in your sample), but rather what you expect to observe if the null hypothesis is true. This distinction is crucial in statistical tests like the chi-square test, where the comparison between observed and expected frequencies helps determine the validity of the hypothesis.
Calculating Expected Frequency: Different Scenarios
The method for calculating expected frequency varies depending on the context. Let's explore some common scenarios:
1. Expected Frequency in a Contingency Table (Chi-Square Test)
This is arguably the most frequent application of expected frequency calculation. In a chi-square test, we analyze the relationship between two categorical variables. The contingency table displays the observed frequencies for each combination of categories. The expected frequency for each cell in the table is calculated using the following formula:
Expected Frequency (E) = (Row Total * Column Total) / Grand Total
Let's illustrate this with an example:
Suppose we're investigating the relationship between gender and preference for coffee or tea. Our observed data might look like this:
| Coffee | Tea | Total | |
|---|---|---|---|
| Male | 50 | 30 | 80 |
| Female | 40 | 60 | 100 |
| Total | 90 | 90 | 180 |
To calculate the expected frequency for "Male and Coffee":
- Row Total (Male) = 80
- Column Total (Coffee) = 90
- Grand Total = 180
Expected Frequency (Male and Coffee) = (80 * 90) / 180 = 40
We would repeat this calculation for each cell in the contingency table to obtain the complete set of expected frequencies.
2. Expected Frequency in Probability Distributions
When dealing with probability distributions (like binomial, Poisson, or normal distributions), the expected frequency for a specific event or range of events is calculated using the probability of that event and the total number of trials or observations.
-
Binomial Distribution: The expected frequency of getting k successes in n independent Bernoulli trials, each with probability p of success, is given by:
E(k) = n * p
-
Poisson Distribution: The expected frequency of observing k events in a given interval, with an average rate of λ events per interval is given by the Poisson probability mass function:
E(k) = (e^-λ * λ^k) / k!
-
Normal Distribution: The expected frequency within a specific range of values in a normal distribution requires integration of the probability density function. This is usually done using statistical software or tables.
3. Expected Frequency in Forecasting and Time Series Analysis
In forecasting, expected frequency can relate to the anticipated occurrence of events over time. For instance, if a company averages 10 sales per day, the expected frequency of sales on a given day is 10. More sophisticated forecasting models incorporate factors like seasonality and trends to provide more accurate expected frequencies.
Interpreting Expected Frequencies
The significance of expected frequencies lies in their comparison with observed frequencies. A substantial discrepancy between the two suggests that the underlying assumptions (e.g., the null hypothesis in a chi-square test) might be incorrect.
-
Small Discrepancies: Small differences between observed and expected frequencies are often attributable to random chance and do not necessarily invalidate the underlying model.
-
Large Discrepancies: Large differences, however, indicate a potential problem with the model or hypothesis. Statistical tests, like the chi-square test, quantify the significance of these discrepancies.
Applications of Expected Frequency Calculations
The applications of expected frequency calculations are vast and span numerous fields:
-
Genetics: Analyzing Mendelian inheritance patterns and testing for deviations from expected ratios.
-
Quality Control: Monitoring defect rates in manufacturing processes and assessing whether observed rates deviate significantly from expected rates.
-
Market Research: Evaluating customer preferences and analyzing the relationship between different market segments.
-
Epidemiology: Investigating the incidence of diseases and identifying potential risk factors.
-
Ecology: Analyzing species distribution and testing for habitat preferences.
Potential Pitfalls and Considerations
While expected frequency calculations are powerful tools, it's essential to be aware of potential pitfalls:
-
Sample Size: Expected frequencies should be sufficiently large (generally above 5) for accurate results. Small expected frequencies can lead to inaccurate conclusions.
-
Independence of Observations: The accuracy of expected frequency calculations relies on the independence of observations. If observations are correlated, the results can be misleading.
-
Assumptions of the Underlying Model: The accuracy of expected frequencies depends on the validity of the underlying probability model or null hypothesis. If the assumptions of the model are violated, the results may not be reliable.
-
Data Quality: Inaccurate or incomplete data will inevitably lead to inaccurate expected frequencies.
Software and Tools for Calculating Expected Frequencies
Many statistical software packages and online calculators can simplify the calculation of expected frequencies, particularly for complex scenarios involving large datasets or intricate probability distributions. Popular choices include:
-
R: A powerful and versatile open-source statistical software environment.
-
Python (with libraries like SciPy and Statsmodels): Another popular choice for statistical computing.
-
SPSS: A comprehensive commercial statistical software package.
-
Excel: While not as sophisticated as dedicated statistical software, Excel can handle basic expected frequency calculations for smaller datasets.
Conclusion
Calculating expected frequency is a fundamental skill in statistics with wide-ranging applications. By understanding the different methods of calculation, their interpretations, and potential pitfalls, you can leverage this powerful tool effectively across various disciplines. Remember to always consider the context, assumptions, and data quality when interpreting results. This guide provides a solid foundation for your journey into the world of statistical analysis and its essential element, expected frequency. As your understanding deepens, explore more complex scenarios and advanced statistical techniques to enhance your analytical capabilities. Remember to always verify your calculations and interpretations with additional resources and consult with statisticians when dealing with intricate datasets or challenging hypotheses.
Latest Posts
Latest Posts
-
Hey Mom I Finished That Book About Jennifer
Mar 10, 2025
-
Documents Are Marked With A Number And Then A Name
Mar 10, 2025
-
Relationship Management Principles Are Fundamental To
Mar 10, 2025
-
Today You Need To Complete Any Financial
Mar 10, 2025
-
How To Get Tinder Gold Free
Mar 10, 2025
Related Post
Thank you for visiting our website which covers about How Do You Calculate Expected Frequency . We hope the information provided has been useful to you. Feel free to contact us if you have any questions or need further assistance. See you next time and don't miss to bookmark.
