Draw The Shear Diagram For The Beam.
Holbox
Mar 15, 2025 · 7 min read
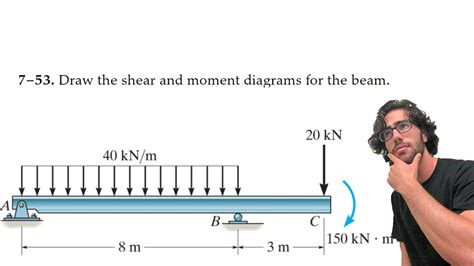
Table of Contents
Drawing Shear Diagrams for Beams: A Comprehensive Guide
Understanding shear diagrams is crucial for structural engineers and anyone working with beams. A shear diagram visually represents the internal shear forces acting along a beam's length under various load conditions. This diagram is essential for determining the beam's strength, designing appropriate supports, and predicting potential failure points. This guide will provide a comprehensive understanding of how to draw shear diagrams for beams, covering various load types and support conditions.
Understanding Shear Forces in Beams
Before diving into drawing shear diagrams, let's establish a fundamental understanding of shear forces. When a beam is subjected to external loads (like point loads, uniformly distributed loads, or moments), internal forces develop to maintain equilibrium. These internal forces consist of shear forces and bending moments.
Shear force at any section of a beam is the algebraic sum of all vertical forces acting on either side of that section. It represents the force that tends to cause one section of the beam to slide past the other. A positive shear force is generally defined as one that causes upward movement on the left side of the section.
Steps to Draw a Shear Diagram
The process of drawing a shear diagram involves a systematic approach:
-
Determine the Reactions: This is the critical first step. Employing static equilibrium equations (ΣF<sub>y</sub> = 0 and ΣM = 0), calculate the vertical reactions at the supports of the beam. Accurate reaction forces are the foundation of a correct shear diagram.
-
Choose a Sign Convention: Consistently apply a sign convention for shear forces. A common convention is:
- Positive Shear: Upward forces on the left side of a section (or downward on the right).
- Negative Shear: Downward forces on the left side of a section (or upward on the right).
-
Section the Beam: Imagine cutting the beam at various points along its length. Consider the forces acting on either side of the cut section.
-
Calculate Shear Force at Each Section: For each section, determine the algebraic sum of all vertical forces acting to the left (or right) of the section, adhering to your chosen sign convention. Remember to include reaction forces and any applied loads.
-
Plot the Shear Values: Plot the calculated shear forces against their corresponding positions along the beam's length. Connect these points to create the shear diagram.
Different Load Types and their Effect on Shear Diagrams
The shape of the shear diagram significantly depends on the type of load applied to the beam. Let’s examine the most common load types:
1. Point Loads (Concentrated Loads):
A point load is a force acting at a single point on the beam. The shear diagram will exhibit a sudden jump or drop at the point of application of the load. The magnitude of the jump or drop equals the magnitude of the point load.
Example: A simply supported beam with a single point load at its mid-point will show a linear increase in shear from zero at one support, a sudden drop equal to the point load at the mid-point, and then a linear decrease to zero at the other support.
2. Uniformly Distributed Loads (UDL):
A UDL is a load distributed uniformly along the beam's length. The shear diagram for a UDL is linear, with a slope equal to the magnitude of the load intensity (force per unit length).
Example: A simply supported beam subjected to a UDL will have a linearly varying shear diagram, starting from the reaction force at one support and decreasing linearly to the reaction force at the other support.
3. Uniformly Varying Loads (UVL):
A UVL increases or decreases linearly along the beam's length. The shear diagram for a UVL is parabolic. The slope of the shear diagram at any point is equal to the intensity of the load at that point.
Example: A cantilever beam with a UVL increasing from zero at the free end to a maximum value at the fixed end will show a shear diagram with a parabolic shape, starting from zero at the free end and increasing to a maximum value at the fixed end.
4. Triangular Loads:
Triangular loads are distributed loads whose intensity varies linearly along the beam's length. The shear diagram for a triangular load is parabolic.
Example: A simply supported beam with a triangular load will show a shear diagram with a parabolic shape, changing curvature at the point where the load intensity changes.
5. Combination of Loads:
Real-world beams often experience combinations of different load types. In such cases, the shear diagram will reflect the combined effect of all loads. Calculate the shear force at each point by summing the contributions from all loads acting on the section. Remember to consider the direction and magnitude of each load.
Support Conditions and their Influence
The type of support significantly influences the shear diagram. Here are some common support types:
1. Simply Supported Beam:
A simply supported beam rests on supports at both ends, allowing for rotation but preventing vertical movement. The shear diagram for a simply supported beam typically starts and ends at zero.
2. Cantilever Beam:
A cantilever beam is fixed at one end and free at the other. The shear diagram for a cantilever beam usually starts at the reaction force at the fixed end and varies according to the applied loads.
3. Overhanging Beam:
An overhanging beam extends beyond its supports. The shear diagram for an overhanging beam will exhibit changes in shear at the points where the beam overhangs.
4. Fixed Beam:
A fixed beam is restrained against both rotation and vertical movement at both ends. The shear diagram for a fixed beam will depend on the applied loads and the fixed-end reactions. Determining the reactions for a fixed beam requires considering moment equilibrium.
Interpreting Shear Diagrams
Once you have constructed the shear diagram, it provides crucial information about the beam:
-
Points of Zero Shear: These points are essential for determining the location of maximum bending moments. Maximum bending moments usually occur at points where the shear force changes sign.
-
Maximum Shear Force: This value is critical for determining the shear strength required for the beam material. The beam must be capable of resisting the maximum shear force without failure.
-
Shear Stress: The shear diagram can be used to calculate shear stress within the beam using the formula: τ = VQ/Ib, where V is the shear force, Q is the first moment of area, I is the moment of inertia, and b is the width of the beam.
-
Design Considerations: The shear diagram helps in selecting appropriate materials and dimensions for the beam to ensure structural integrity under the applied loads. The maximum shear force and the points of zero shear are particularly important for design purposes.
Advanced Techniques and Considerations
For more complex beam configurations and loading scenarios, more advanced techniques might be necessary:
-
Influence Lines: Influence lines are used to determine the effect of a moving load on the shear force at a specific point on the beam.
-
Computer-Aided Design (CAD) Software: CAD software packages offer tools for analyzing beams and generating shear diagrams automatically. This is especially useful for complex structures with multiple loads and support conditions.
-
Finite Element Analysis (FEA): FEA is a powerful numerical method for analyzing the behavior of complex structures under various loading conditions. It provides detailed information about the shear stresses and strains within the beam.
Conclusion: Mastering Shear Diagram Construction
Drawing shear diagrams is a fundamental skill in structural analysis. Understanding the principles involved, along with practice, will enable you to accurately represent and interpret the internal shear forces within beams subjected to various load conditions. This skill is essential for ensuring the safety and structural integrity of any beam-based structure. Remember to meticulously follow the steps, pay close attention to sign conventions, and accurately calculate reaction forces. With consistent practice and attention to detail, you will master the art of drawing shear diagrams and confidently analyze the behavior of beams under load. By combining this understanding with practical experience, you'll be well-equipped to tackle a wide range of structural engineering challenges. Remember to always double-check your calculations and consider using software tools for more complex scenarios.
Latest Posts
Latest Posts
-
The Usual Starting Point For A Master Budget Is
Mar 15, 2025
-
A Constraint In A Decision Is Blank
Mar 15, 2025
-
The Goal Of Is To Share Resources Especilaly
Mar 15, 2025
-
How Are Diploid Cells Homologous Chromosomes And Alleles Related
Mar 15, 2025
-
Early Americans Preference For Limited Government Was Strengthened By
Mar 15, 2025
Related Post
Thank you for visiting our website which covers about Draw The Shear Diagram For The Beam. . We hope the information provided has been useful to you. Feel free to contact us if you have any questions or need further assistance. See you next time and don't miss to bookmark.
