Determine The T-value In Each Of The Cases
Holbox
Mar 29, 2025 · 7 min read
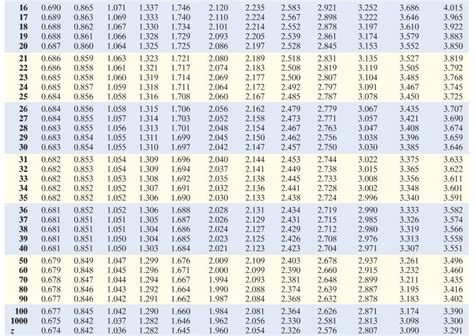
Table of Contents
- Determine The T-value In Each Of The Cases
- Table of Contents
- Determining the T-Value: A Comprehensive Guide
- Understanding the T-Value
- Cases for Determining the T-Value
- Case 1: One-Sample T-Test
- Case 2: Two-Sample Independent T-Test
- Case 3: Paired-Samples T-Test
- Case 4: One-Sample T-Test for Proportion
- Case 5: Considering Sample Size and Degrees of Freedom
- Case 6: Choosing the Correct Significance Level (Alpha)
- Case 7: Interpreting the T-Value and p-Value
- Case 8: Handling Outliers
- Case 9: Assumptions of the T-Test
- Conclusion: Mastering the T-Value
- Latest Posts
- Latest Posts
- Related Post
Determining the T-Value: A Comprehensive Guide
The t-value, a crucial statistic in hypothesis testing, plays a pivotal role in determining whether to reject or fail to reject a null hypothesis. Understanding how to determine the t-value in different scenarios is fundamental for anyone working with statistical data analysis. This comprehensive guide explores various cases, providing clear explanations and practical examples.
Understanding the T-Value
Before delving into specific cases, let's solidify our understanding of the t-value itself. The t-value is a measure of the difference between a sample mean and a population mean, relative to the variability within the sample. It essentially tells us how many standard errors the sample mean is away from the population mean. This is particularly useful when the population standard deviation is unknown, which is often the case in real-world scenarios.
The formula for calculating the t-value is:
t = (x̄ - μ) / (s / √n)
Where:
- x̄ represents the sample mean.
- μ represents the population mean.
- s represents the sample standard deviation.
- n represents the sample size.
The resulting t-value is then compared to a critical t-value obtained from a t-distribution table, considering the degrees of freedom (df = n - 1) and the chosen significance level (alpha). If the calculated t-value exceeds the critical t-value, we reject the null hypothesis; otherwise, we fail to reject it.
Cases for Determining the T-Value
Let's examine various scenarios encountered in determining the t-value:
Case 1: One-Sample T-Test
This is the most basic case, where we compare the mean of a single sample to a known population mean. This test is used when we want to determine if the sample mean is significantly different from the population mean.
Example: A researcher wants to determine if the average height of students in a particular school is significantly different from the national average height of 170 cm. They collect a sample of 50 students, measure their heights, and calculate the sample mean (x̄) and sample standard deviation (s). They then use the formula above to calculate the t-value, comparing it to the critical t-value at their chosen significance level (e.g., α = 0.05) with 49 degrees of freedom.
Case 2: Two-Sample Independent T-Test
This test compares the means of two independent samples. This is used when we want to determine if there's a significant difference between the means of two different groups. There are two variations:
-
Equal Variances Assumed: This is used when we assume that the population variances of the two groups are equal. The pooled standard deviation is calculated and used in the t-value formula.
-
Equal Variances Not Assumed: This is used when we cannot assume that the population variances are equal. Separate standard deviations are used for each group in the t-value calculation, leading to a slightly different formula.
Example: A pharmaceutical company wants to compare the effectiveness of two different drugs in lowering blood pressure. They randomly assign participants to two groups, one receiving drug A and the other receiving drug B. After a trial period, they measure the blood pressure of each participant and calculate the mean and standard deviation for each group. They then use the appropriate two-sample t-test (equal or unequal variances) to calculate the t-value and determine if there's a significant difference in the effectiveness of the two drugs.
Case 3: Paired-Samples T-Test
This test is used when the samples are dependent, meaning that the same subjects are measured twice (e.g., before and after treatment). This is often used in before-and-after studies.
Example: A fitness trainer wants to assess the effectiveness of a new workout program. They measure the weight of 20 participants before starting the program and again after eight weeks. The difference in weight for each participant is calculated, and the mean and standard deviation of these differences are used to calculate the t-value. This t-value is then compared to the critical t-value to determine if the workout program has a significant effect on weight loss.
Case 4: One-Sample T-Test for Proportion
While the t-test is primarily used for means, it can also be adapted to test proportions. This is particularly useful when dealing with binomial data (success/failure).
Example: A marketing team wants to determine if the click-through rate on a new advertisement is significantly different from the historical average click-through rate of 5%. They collect data on the number of clicks and impressions for the new advertisement and calculate the sample proportion. A modified version of the t-test formula, using the standard error of the proportion, is then used to calculate the t-value.
Case 5: Considering Sample Size and Degrees of Freedom
The degrees of freedom (df) significantly impact the t-distribution and the critical t-value. With larger sample sizes (and hence higher degrees of freedom), the t-distribution approaches a normal distribution. This means that with larger samples, the calculated t-value needs to be further from zero to achieve statistical significance at the same alpha level. Conversely, smaller sample sizes require a less extreme t-value for statistical significance. Understanding the interplay between sample size, degrees of freedom, and the t-distribution is crucial for accurate interpretation.
Case 6: Choosing the Correct Significance Level (Alpha)
The significance level (alpha), usually set at 0.05 or 0.01, represents the probability of rejecting the null hypothesis when it is actually true (Type I error). Choosing the appropriate alpha level depends on the context of the study and the consequences of making a Type I error. A lower alpha level (e.g., 0.01) makes it harder to reject the null hypothesis, reducing the risk of a Type I error but increasing the risk of a Type II error (failing to reject a false null hypothesis).
Case 7: Interpreting the T-Value and p-Value
The t-value alone doesn't tell the whole story. It's essential to interpret it in conjunction with the p-value. The p-value represents the probability of obtaining a t-value as extreme as, or more extreme than, the one calculated, assuming the null hypothesis is true. If the p-value is less than the chosen alpha level, we reject the null hypothesis; otherwise, we fail to reject it.
Case 8: Handling Outliers
Outliers can significantly influence the sample mean and standard deviation, thereby affecting the calculated t-value. It's crucial to identify and appropriately handle outliers, either by removing them (with justification) or using robust statistical methods less sensitive to outliers.
Case 9: Assumptions of the T-Test
The validity of the t-test relies on certain assumptions, including:
- Random Sampling: The samples should be randomly selected from the population.
- Independence: Observations within and between samples should be independent.
- Normality: The data should be approximately normally distributed, especially for smaller sample sizes. However, the t-test is relatively robust to violations of normality, particularly with larger sample sizes.
Violations of these assumptions can affect the accuracy and reliability of the t-test results. Appropriate diagnostic checks and alternative non-parametric tests should be considered if assumptions are severely violated.
Conclusion: Mastering the T-Value
Determining the t-value is a fundamental skill in statistical analysis. Understanding the different cases, choosing the correct test, interpreting the results, and considering the assumptions are all critical for accurate and meaningful conclusions. By carefully considering these factors and utilizing the appropriate techniques, researchers and analysts can confidently utilize the t-value to test hypotheses and draw reliable inferences from their data. Remember to always consider the context of your study, the potential limitations, and the implications of your findings. Through diligent application and a thorough understanding of the principles involved, the t-value becomes a powerful tool in your data analysis arsenal.
Latest Posts
Latest Posts
-
All Of The Following Are True About A Corporation Except
Apr 01, 2025
-
What Are Stabilization Exercises Particularly Good For
Apr 01, 2025
-
Karen Believes In Cause Related Programs
Apr 01, 2025
-
A Perfectly Competitive Industry Is Characterized By
Apr 01, 2025
-
The Function Of Pre Krebs Is To
Apr 01, 2025
Related Post
Thank you for visiting our website which covers about Determine The T-value In Each Of The Cases . We hope the information provided has been useful to you. Feel free to contact us if you have any questions or need further assistance. See you next time and don't miss to bookmark.
