Assume That A Procedure Yields A Binomial Distribution
Holbox
Mar 29, 2025 · 5 min read
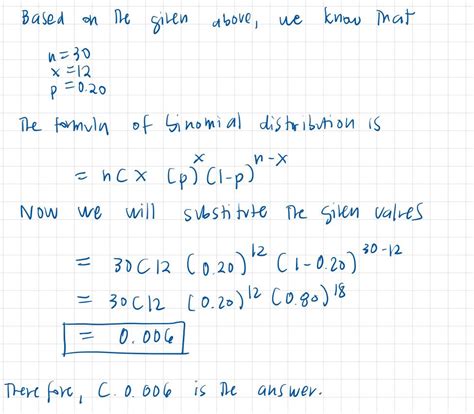
Table of Contents
- Assume That A Procedure Yields A Binomial Distribution
- Table of Contents
- Assume That a Procedure Yields a Binomial Distribution: A Deep Dive into Probability and Statistics
- What is a Binomial Distribution?
- The Binomial Probability Formula
- Example: Coin Toss
- Mean, Variance, and Standard Deviation
- Example: Continuing the Coin Toss
- Applications of Binomial Distributions
- 1. Quality Control:
- 2. Medical Research:
- 3. Market Research:
- 4. Genetics:
- 5. Sports Analytics:
- Interpreting Binomial Distribution Results
- Beyond the Basics: Approximations and Extensions
- 1. Normal Approximation to the Binomial:
- 2. Poisson Approximation to the Binomial:
- Conclusion: The Power and Applicability of Binomial Distributions
- Latest Posts
- Latest Posts
- Related Post
Assume That a Procedure Yields a Binomial Distribution: A Deep Dive into Probability and Statistics
Understanding binomial distributions is crucial in numerous fields, from quality control in manufacturing to analyzing clinical trial data. This comprehensive guide delves into the intricacies of binomial distributions, assuming a procedure yields such a distribution. We'll explore its core characteristics, key formulas, real-world applications, and how to interpret results effectively.
What is a Binomial Distribution?
A binomial distribution is a discrete probability distribution that describes the probability of obtaining exactly k successes in n independent Bernoulli trials. A Bernoulli trial is a random experiment with only two possible outcomes: success or failure. Crucially, the probability of success (denoted as p) remains constant across all trials. Examples abound: flipping a coin (heads or tails), testing a product (defective or non-defective), or surveying individuals (agree or disagree).
Key Characteristics of a Binomial Distribution:
- Fixed Number of Trials (n): The experiment consists of a predetermined number of independent trials.
- Two Possible Outcomes: Each trial results in either success or failure.
- Independent Trials: The outcome of one trial doesn't influence the outcome of any other trial.
- Constant Probability of Success (p): The probability of success remains the same for every trial.
- Discrete Variable: The random variable X (number of successes) can only take on integer values from 0 to n.
The Binomial Probability Formula
The probability of getting exactly k successes in n trials is given by the binomial probability formula:
P(X = k) = (nCk) * p^k * (1-p)^(n-k)
Where:
- P(X = k): Probability of exactly k successes.
- nCk: The number of combinations of n items taken k at a time (also written as ⁿCₖ or C(n,k)). This is calculated as: n! / (k! * (n-k)!), where ! denotes the factorial (e.g., 5! = 54321).
- p: Probability of success on a single trial.
- (1-p): Probability of failure on a single trial (often denoted as q).
Example: Coin Toss
Let's say we flip a fair coin 10 times (n=10). The probability of getting heads (success) is 0.5 (p=0.5). What's the probability of getting exactly 7 heads (k=7)?
Using the formula:
P(X = 7) = (10C7) * (0.5)^7 * (0.5)^(10-7) = 120 * 0.0078125 * 0.125 ≈ 0.117
This means there's approximately a 11.7% chance of getting exactly 7 heads in 10 coin flips.
Mean, Variance, and Standard Deviation
A binomial distribution has specific measures of central tendency and dispersion:
- Mean (μ): The average number of successes expected. μ = n * p
- Variance (σ²): The measure of how spread out the distribution is. σ² = n * p * (1-p)
- Standard Deviation (σ): The square root of the variance. σ = √[n * p * (1-p)]
Example: Continuing the Coin Toss
In our coin toss example (n=10, p=0.5):
- Mean (μ) = 10 * 0.5 = 5
- Variance (σ²) = 10 * 0.5 * 0.5 = 2.5
- Standard Deviation (σ) = √2.5 ≈ 1.58
Applications of Binomial Distributions
The versatility of binomial distributions makes them applicable across numerous fields:
1. Quality Control:
Manufacturers use binomial distributions to determine the probability of a certain number of defective items in a batch. By sampling a subset, they can estimate the overall defect rate and adjust their production process accordingly. This ensures quality standards are met and minimizes customer complaints.
2. Medical Research:
In clinical trials, binomial distributions help assess the effectiveness of a new treatment. The number of patients who respond positively to the treatment (success) versus those who don't (failure) follows a binomial distribution. Analyzing this data helps determine the treatment's efficacy and its statistical significance.
3. Market Research:
Surveys often utilize binomial distributions. For example, determining the proportion of consumers who prefer a particular product over its competitors can be modeled using a binomial distribution. This information is invaluable for marketing strategies and product development.
4. Genetics:
In genetics, the inheritance of certain traits can be modeled using binomial distributions. For example, the probability of a particular genotype appearing in offspring can be calculated using the binomial probability formula.
5. Sports Analytics:
Binomial distributions are frequently employed in sports analytics to model the probability of a player succeeding in a given situation. For instance, the probability of a basketball player making a free throw or a baseball player hitting a home run can be analyzed using this distribution.
Interpreting Binomial Distribution Results
Interpreting the results obtained from a binomial distribution involves understanding the probability associated with different numbers of successes. A high probability indicates a greater likelihood of that specific number of successes occurring. Conversely, a low probability suggests a lower likelihood.
When using statistical software or calculators, you might see confidence intervals alongside probability values. These intervals give a range within which the true proportion of successes is likely to lie, with a certain level of confidence (e.g., 95% confidence interval). This provides a more nuanced understanding beyond just the point probability.
Beyond the Basics: Approximations and Extensions
For large values of n, calculating binomial probabilities directly can be computationally intensive. In such cases, approximations are often used:
1. Normal Approximation to the Binomial:
When both np and n(1-p) are sufficiently large (generally > 5), the binomial distribution can be approximated by a normal distribution. This simplifies calculations considerably, making use of the normal distribution's properties and the readily available normal distribution tables or software.
2. Poisson Approximation to the Binomial:
When n is large and p is small (resulting in n*p being small), the binomial distribution can be approximated by a Poisson distribution. This approximation is particularly useful in situations where the probability of success is very low but the number of trials is very high.
Conclusion: The Power and Applicability of Binomial Distributions
The binomial distribution, while seemingly simple in its definition, provides a powerful framework for understanding and analyzing a wide range of probabilistic events. Its applications span various fields, offering insights into quality control, medical research, market analysis, genetics, and even sports analytics. By understanding its fundamental characteristics, formulas, and interpretative techniques, researchers and practitioners can leverage this statistical tool to make informed decisions based on the probabilities of success and failure. The ability to approximate the binomial distribution under certain conditions further enhances its practicality and applicability across diverse contexts. Remember that accurately identifying situations where a binomial distribution is applicable is key to drawing valid conclusions from the analysis.
Latest Posts
Latest Posts
-
As A Solid Water Floats This Means That
Apr 01, 2025
-
States That Apply The Unit Rule
Apr 01, 2025
-
Which Of The Following Is Not True About Mobile Health
Apr 01, 2025
-
What 2 Tasks Can Be Performed From The Setup Tab
Apr 01, 2025
-
Is Balloon Vine Bigger Than Golden Rain Tree
Apr 01, 2025
Related Post
Thank you for visiting our website which covers about Assume That A Procedure Yields A Binomial Distribution . We hope the information provided has been useful to you. Feel free to contact us if you have any questions or need further assistance. See you next time and don't miss to bookmark.
